A range is a set of decisions, and each one needs its own grain
How many options a class carries is a decision at class and cluster. Which styles earn their place is a decision at style and colour. How deep each size runs is a decision at size. Which stores carry which options is a decision at store. A private label style is a decision about a blank. An assortment dataset that stores only the outcome, the SKU list, can report what was ranged and nothing about why.
The Cybex Assortment Planning dataset is five facts, one per decision, on one product hierarchy and one store cluster model. All five read the same item master, the same sales facts and the same demand rate the planning, allocation and buying datasets use. Nothing on this page is specific to one retailer: hierarchy levels, attribute names, cluster schemes, size tables and the private-label family convention are mapped to generic values at load time.
Five facts, one product hierarchy
| Fact | Grain | Question it answers | Loaded from |
|---|---|---|---|
| Range architecture | One row per class, cluster, season and price band or attribute | How many options, at what depth, to hit the class plan in this cluster? | Merchandise plan targets, last-season option counts and productivity, planner input |
| Style performance | One row per style and colour per period; store beneath it | Did this option earn its place, and where is it in its life? | Sales fact, movement history, receipts, markdowns, item master |
| Size and colour curves | One row per style (or model or blank), colour and size | What share of demand does each size and colour take, and where is the run broken? | A year of sales at SKU grain, ranged sizes from the item master, size tables, store index |
| Store range | One row per store, cluster and style | Which stores carry which options, how well does each conform, and where is the white space? | Store cluster model, location stock, sales by store, range architecture |
| Product family | One row per blank and private label style, with colour and size rows beneath | Which private label styles hang on which blank, do their colours and sizes match, and what does the family need? | Item master family code, blank and private label stock, work orders, family sales |
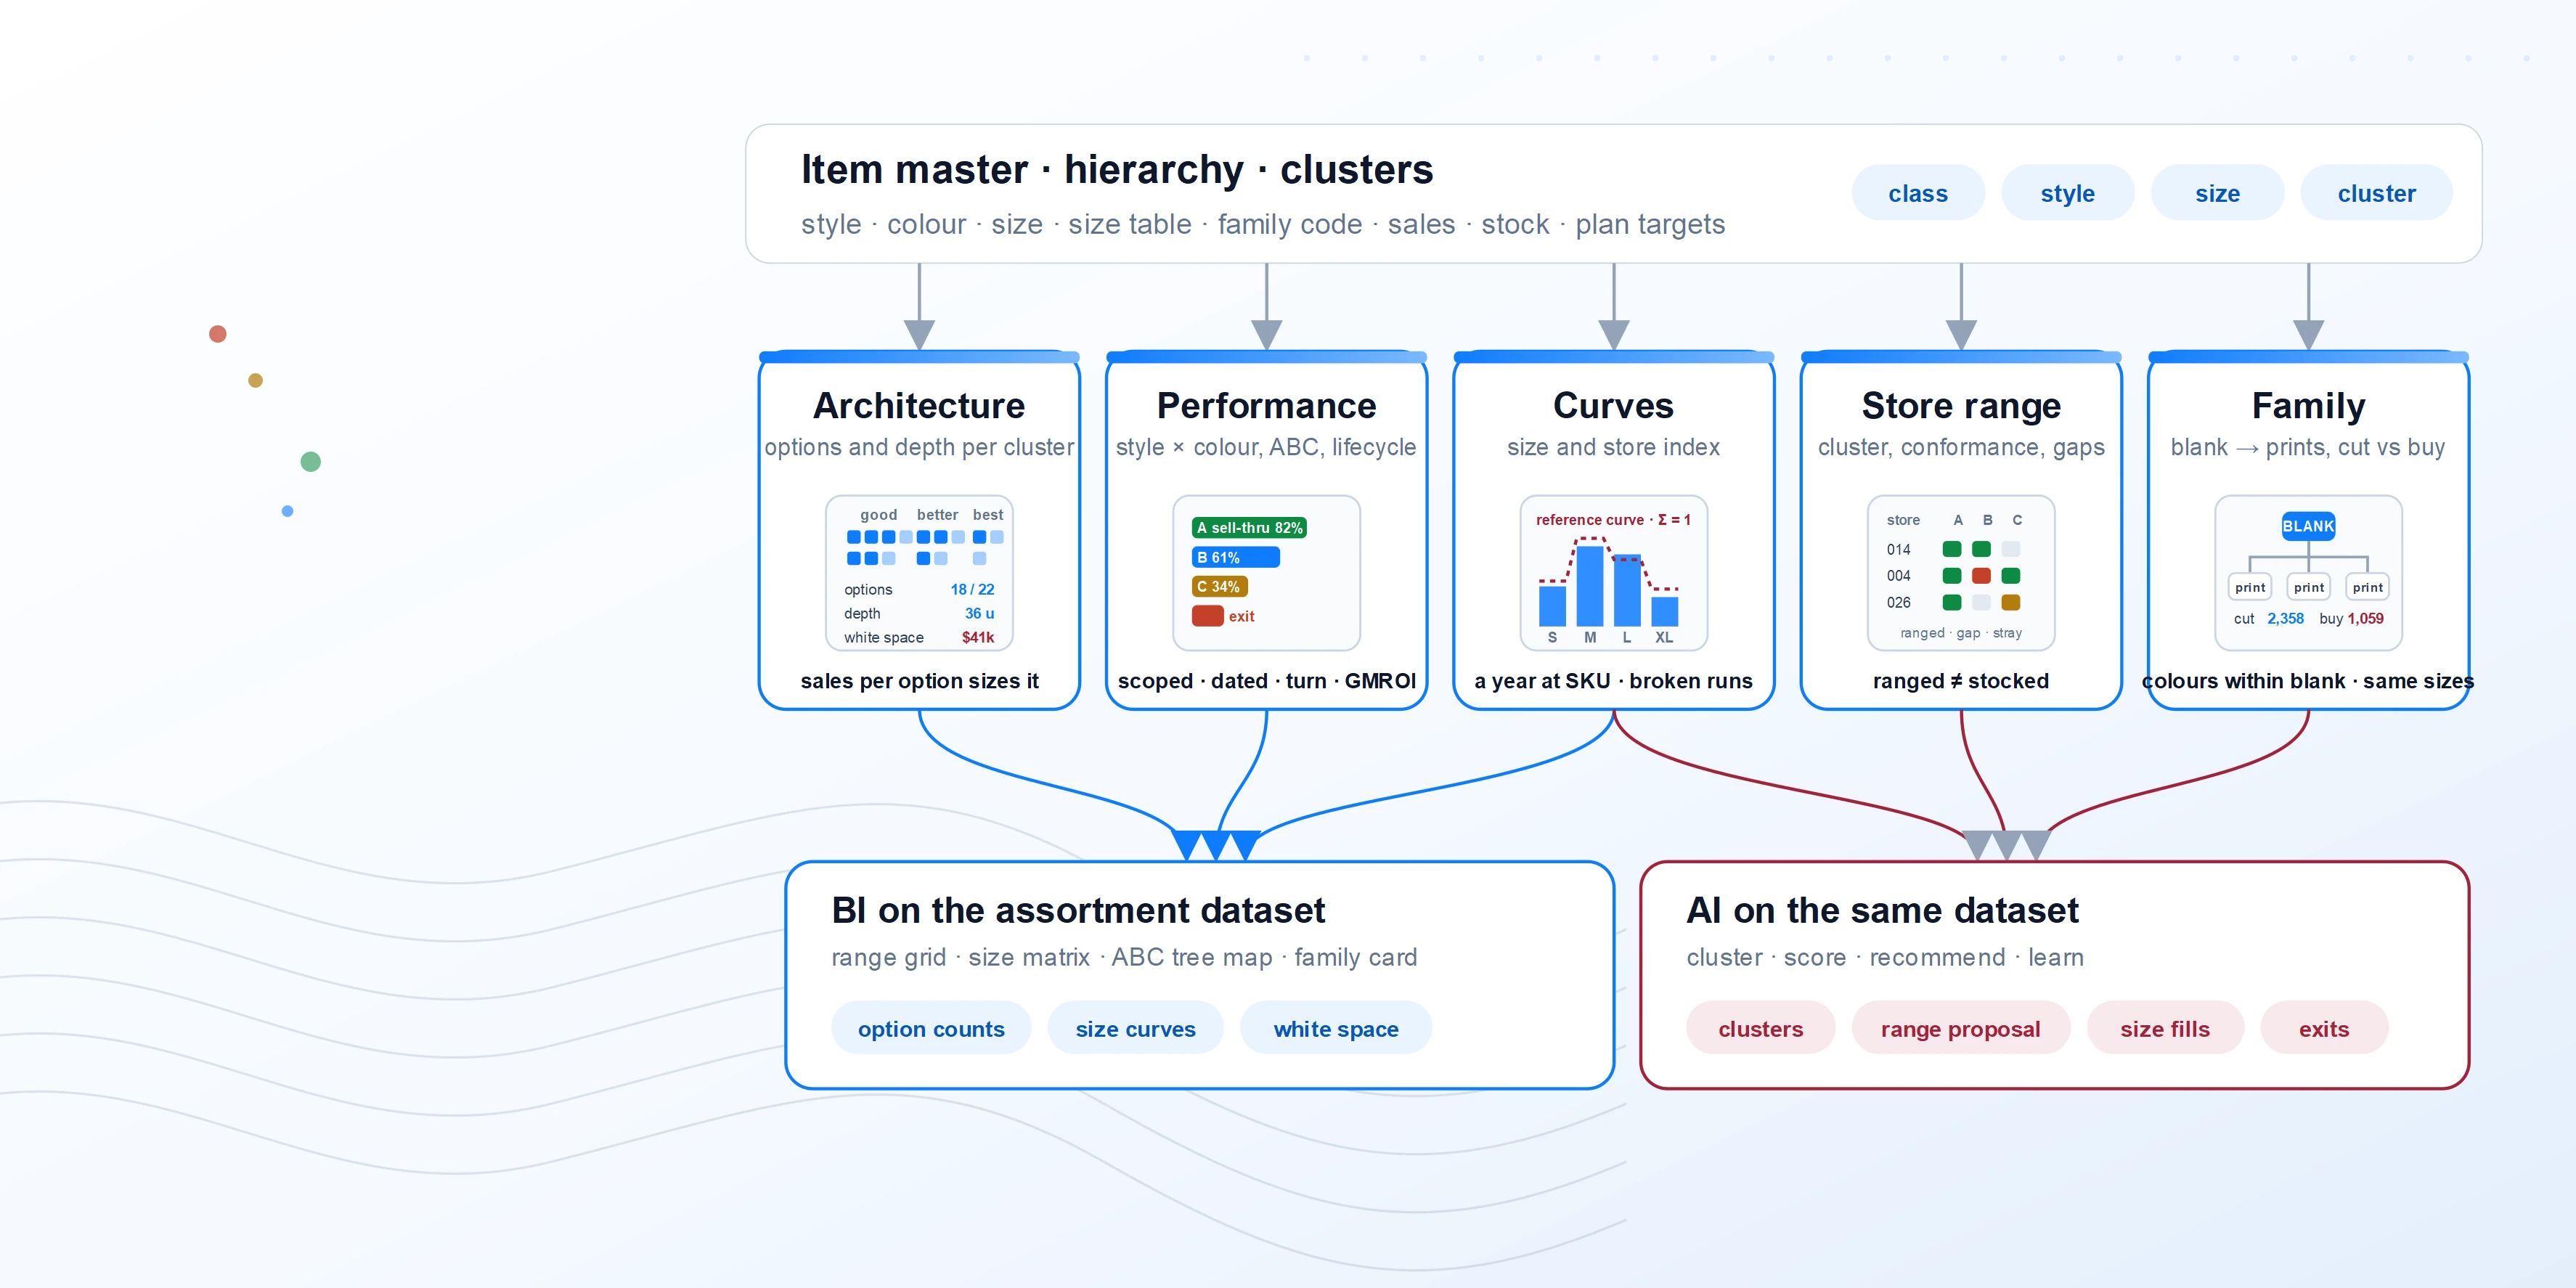
Figure: the five facts share the product hierarchy and the cluster model, so an option count, a size run and a store's white space all resolve to the same styles.
Generic dataset attributes
Attributes are grouped by role. BI marks the ones the range grid, size matrix and performance reports aggregate; AI marks the ones the clustering, scoring and range-recommendation models consume. Most are both.
Range architecture
| Group | Attributes | Notes | Used by |
|---|---|---|---|
| Identity | Division, Department, Class, Subclass, Category (clothing, souvenirs, blanks, other), Season, Cluster, Price band, Attribute set (fabric, fit, colour family, theme), Plan version | Category names the non-retail groups: blanks are a supply category and never a store range. The hierarchy is the same one the plan and the buy use. | BIAI |
| Targets | Sales plan, Margin plan, Units plan, Option count target, Depth target (units per option), Choice count per price band, Core, fashion and seasonal mix | Targets come from the merchandise plan at class and period; the architecture distributes them across options and clusters. | BIAI |
| Last season | Options carried, Options that sold through, Sales per option, Margin per option, Average depth, Sell-through, Turn | Productivity per option is the number that sizes the next range, not total sales. | BIAI |
| Derived | Planned sales per option, Planned depth, Breadth index (options ÷ last season), Depth index, Option gap (target − ranged), White space value | White space = seasonal potential minus planned or actual, at attribute or price band, valued at retail. | BIAI |
Style performance
| Group | Attributes | Notes | Used by |
|---|---|---|---|
| Identity | Style, Colour, Class, Vendor, Season code, Price, Regular price, Cost, Attributes, First received, Last received, First sale, Last sale, Weeks in stock, Lifecycle stage (launch, growth, maturity, decline, exit) | Lifecycle is derived from weeks in stock and the sales curve, not entered; first received caps every rate calculation. | BIAI |
| Flow | Units sold, Sales, Gross margin, Markdown units, Markdown value, Returns, Received units, Received value; each by period and trailing 4, 13, 26, 52 weeks | Additive across periods; sourced from the sales fact and movement history the other datasets use. | BIAI |
| Position | On hand (stores), On hand (DC), On order, Stock at retail, Stock at cost, Weeks of supply, Stores stocking, Stores selling | Stock is a snapshot; stores stocking and stores selling separate a slow style from an unranged one. | BIAI |
| Productivity | Sell-through (units sold ÷ units received), Turn (12-month), GMROI, Margin rate, Full-price share, Rank within class (units, sales, margin), ABC code, ABC scope, ABC date | ABC is computed within a scope (class, category, chain) and dated; a style's code carries the scope it was ranked in. | BIAI |
| Rate | De-seasonalised weekly rate, Seasonality index, Forecast 4, 13, 26 and 52 weeks | The same demand feature the planning and allocation datasets read; never re-derived here. | AI |
Size and colour curves
| Group | Attributes | Notes | Used by |
|---|---|---|---|
| Identity | Curve basis (model, style, colour, blank), Style, Colour, Size, Size table, Size sequence, Ranged flag, Curve date | The curve basis is a choice the planner makes; the sizes come from the size table the item master assigns, and a size the style is not ranged for is absent, not zero. | BIAI |
| Size curve | Units in the last year at SKU, Size share, Size index (sums to one per style), Reference curve share, Deviation from reference (points), Divergence score, Skew (runs large, runs small, on curve, mixed) | Shares use a full year of sales at SKU grain so short windows do not distort the run. The reference curve is the model or blank curve the colour is compared against. | BIAI |
| Colour curve | Colour share of style, Colour index, Colour rank, Colour count carried, Colours with no sales, Name-drop flag | Name-drop and seasonal colours are flagged so a colour dropped by design is not read as a failure. | BIAI |
| Store curve | Store index per style (sums to one), Cluster index, Store size profile | Store index apportions a chain rate to a store; a store's own size profile localises the size curve where the store has enough history. | AI |
| Run health | Sizes in stock, Sizes out of stock, Broken-run flag, Core sizes missing, Fringe sizes overstocked, Size fill from DC possible | A run is broken when a core size is out while fringe sizes remain; the flag feeds allocation and markdown. | BIAI |
Store range
| Group | Attributes | Notes | Used by |
|---|---|---|---|
| Identity | Store, Cluster, Cluster method (volume, climate, demographic, behavioural), Region, Store type and grade, Floor capacity, Category mix allowed | Cluster membership is dated and versioned; a store can move between seasons. | BIAI |
| Range membership | Style, Colour, Ranged flag (planned), Stocked flag (actual), Stocking since, Delisted date, Range reason (core, cluster, local, test) | Ranged and stocked are different columns: a style can be ranged and empty, or stocked and never ranged (a stray). | BIAI |
| Performance at store | Units, Sales, Margin, Weeks of supply, Rate at store, Sell-through at store, Rank in store, Share of cluster average | Rate at store uses the store index; comparisons are against the cluster, not the chain. | BIAI |
| Conformance | Options ranged versus architecture, Depth versus target, Missing options, Extra options, Conformance %, White space at store (attribute or price band), Cannibalisation flag | Conformance is measured against the cluster's architecture, and white space at store is the local gap the range should close. | BIAI |
Product family (private label)
| Group | Attributes | Notes | Used by |
|---|---|---|---|
| Identity | Blank style, Private label style, Family code, Family role (blank, private label, other), Colour, Size, Size table match flag, Colour subset flag | A private label style's colours must be a subset of its blank's and its size table must equal the blank's; violations are integrity exceptions, not range decisions. | BIAI |
| Family demand | Private label units and sales, Family units and sales (consolidated to the blank), Private label forecast per horizon, Family rate, Colour and size demand rolled to the blank | Demand rolls up from private label styles to the blank by colour and size, since the blank is what gets bought and the private label style is what gets sold. | BIAI |
| Family supply | Blank on hand, Blank on order, Private label on hand (finished), Private label on order (work orders), Blank supply available (blank stock + finished private label styles + blank on order − production work orders) | Finished private label styles count as supply; work orders in progress consume blank stock. | BIAI |
| Family decisions | Private label requirement (cut), Blank requirement (buy), Private label styles per blank, Blank size curve by colour, Colour divergence from the blank curve, Name-drop candidates | The blank curve applied to every colour is the reference; a colour that diverges is a private label decision, not a blank decision. | BIAI |
SizeIndex(size) = Units(size, last year) ÷ Units(style, last year) · Σ SizeIndex = 1 per style
WhiteSpace = SeasonalPotential − Planned (or Actual), by attribute or price band, at retail
Functional areas and what each reads
| Functional area | Reads | Deciding attributes | BI output | AI output |
|---|---|---|---|---|
| Range architecture | Architecture, Performance | Option count and depth targets, sales per option, price-band mix, core and fashion mix | Range grid by class, cluster and price band with last season beside it; option gap | Recommended option count and depth per class and cluster from productivity and the plan |
| Style and colour review | Performance | Sell-through, margin, turn, ABC, lifecycle, colour share | Top sellers, style rank, price analysis, vendor sales, unit sales received, ABC tree maps by category and vendor | Keep, grow, reduce and exit scoring per option; colour recommendations for the next season |
| Size curve and size model | Curves | Size share, reference curve, divergence, skew, ranged sizes | Size curve by blank, colour and model; size matrix drill from any style; broken-run list | Size model refresh; detection of colours whose curve diverges from the reference; size fill suggestions |
| Store clustering and localisation | Store range, Curves | Cluster method, store index, store size profile, category mix | Cluster membership and profile; store range conformance; missing and extra options by store | Cluster assignment; local option recommendations where a store's profile diverges from its cluster |
| White space and cannibalisation | Architecture, Performance, Store range | Seasonal potential, planned and actual by attribute and price band, overlap between options | White-space heat map by category, class and retail month; gaps ranked by value | Attribute-level demand estimates for gaps; cannibalisation detection between overlapping options |
| Private-label family planning | Product family, Curves | Family demand, blank supply, size table and colour subset, blank size curve | Family card: private label styles per blank, family sales, cut versus buy, blank curve versus each colour | Private label portfolio suggestions per blank; blank curve recommendations by colour |
| Range integrity | Curves, Store range, Product family | Ranged versus stocked, size table membership, colour subset, strays in non-retail categories | Integrity exceptions: sizes outside the size table, orphan colours, blanks in stores, stocked but unranged | Prioritised corrections by units and value affected |
| In-season review and exit | Performance, Store range | Sell-through versus plan, weeks of supply, lifecycle stage, full-price share | Sell-through tracker; exit and markdown candidates; range delist list | Exit timing and markdown depth per option from the lifecycle curve |
Rules the dataset carries
Item master and integrity
- The item master is the truth for what exists. Which colours and sizes a style has comes from the item master and its size table; sales roll-ups are for ranking, never for deciding what a style is.
- Every size belongs to the style's size table. A size outside the table is an integrity exception; a size inside the table with no sales is a ranged size with zero, and is shown as such.
- Private label styles inherit from their blank. A private label style's colours are a subset of the blank's and its size table equals the blank's; the family join uses the family code, trimmed, with the blank excluded from its own prints.
- Blanks are a supply category, not a store range. Store-facing ranges exclude the blank category by category, not by list; a blank found in a store is a stray to correct.
Curves and scoring
- Indices sum to one. Size and store indices are normalised per style, so a class total, a store rate and a size tile always reconcile.
- A year at SKU grain for the curve. Size shares use a full year of SKU sales so a short window and a broken run do not shape the model.
- ABC and rank are scoped and dated. A code carries the scope it was computed in and the date, so last season's A is comparable with this season's.
- Ranged and stocked are different facts. Conformance measures the plan; strays and gaps measure the shelf; neither is inferred from the other.
Architecture and white space
- Productivity per option sizes the range. Option counts are set from sales and margin per option against the class plan, not from last season's count.
- White space is measured against seasonal potential. The gap is planned or actual versus the potential for that attribute in that retail month, valued at retail, on flow measures only; stock snapshots are never summed into it.
- Localise from the cluster. A store's range is its cluster's architecture plus documented local exceptions; the exception carries its reason.
Process workflow
The assortment cycle runs by season with a monthly review. The Hub keeps the performance, curve and store-range facts current; planners and buyers build and localise the range; the AI layer clusters, scores and recommends, then learns from sell-through.
Cadence
| When | Step | Output | Owner |
|---|---|---|---|
| By season | Set targets, cluster, architect, build, localise | Range architecture, store ranges, size and colour plan, family plan | Merchandise planning, buying |
| Nightly | Load and score | Performance, curves, store range, integrity exceptions | AI Data Hub |
| Weekly | In-season review | Sell-through versus plan, broken runs, exit candidates, strays | Buyers, planners |
| Monthly | White space and conformance | White-space heat map, store conformance, local exceptions | Merchandise planning, store operations |
| Seasonally | Learn and tune | Cluster refresh, size model refresh, productivity benchmarks | Planning, data science |
Where BI ends and AI begins
BI on the assortment dataset
AI on the same dataset
Both read the same five facts. The option a buyer keeps in the range grid is the option the scoring model ranked, and the size run the matrix shows broken is the run the allocation engine is asked to fill.
What a conforming dataset delivers
Ranges sized by productivity. Option counts and depth come from sales and margin per option against the plan, per cluster, with the white space ranked beside them.
Curves that reconcile. Size, colour and store indices sum to one per style, come from a year at SKU grain, and respect the item master, so the size matrix, the buy and the allocation agree.
Private label planned as a family. Demand rolls up to the blank, supply counts finished private label styles, and cut-versus-buy is decided per colour and size.
Deployment approach
Confirm hierarchy levels, category roles, attributes and price bands; validate the item master against its size tables and the family code; run the integrity checks and fix strays before any curve is built.
Build style performance with ABC and lifecycle, size and colour curves from a year at SKU grain, and store indices. Publish top sellers, size matrix, size model and ABC tree maps.
Cluster stores, load last season's option productivity, derive the range architecture from the class plan, and publish the range grid, conformance and white-space heat map.
Add the private-label family fact and cut-versus-buy, connect the range to the buy and to allocation, switch on option scoring and size-fill recommendations, and start the seasonal cluster and curve refresh.