Two problems, kept apart on purpose
DC distribution injects stock into the store network: units the business already owns, moved from a warehouse to the shelf that will sell them. Store allocation redistributes within the network: surplus in one store moved to a deficit in another, creating no new units. They are discussed as one thing and they are not the same size, and a dataset that nets them together hides where the value sits.
The Cybex Distribution & Allocation dataset keeps the two legs separate all the way from the movement ledger to the report column, while both read the same store position and the same demand rate. Nothing on this page is specific to one retailer: client movement types, site flags and index conventions are mapped to the generic values at load time.
Five facts, one movement ledger
| Fact | Grain | Question it answers | Loaded from |
|---|---|---|---|
| Store position | One row per store and SKU with live demand | What does each store hold, have coming, and need over the cover horizon? | Location stock, open purchase orders, open transfers, minimums, demand features |
| DC flow | One row per DC and activity date; line and lane drills beneath it | What came in, what went out, to whom, with how many hours? | Movement history with counterparties, timecards, product and location masters |
| Demand features | One row per style and colour, with store and size indices | How fast does it sell, where, and in which sizes? | Weekly sales history, seasonality index, store index, size curve, weeks in stock |
| Allocation plan | One row per source, destination and SKU | Which units move from where to where, and why? | The allocation engine's output, DC leg and store leg tagged separately |
| Replenishment lane | One row per DC, destination and date | How often and how much does each store receive, in both directions? | Transfer legs of the DC flow with destination attributes and cadence |
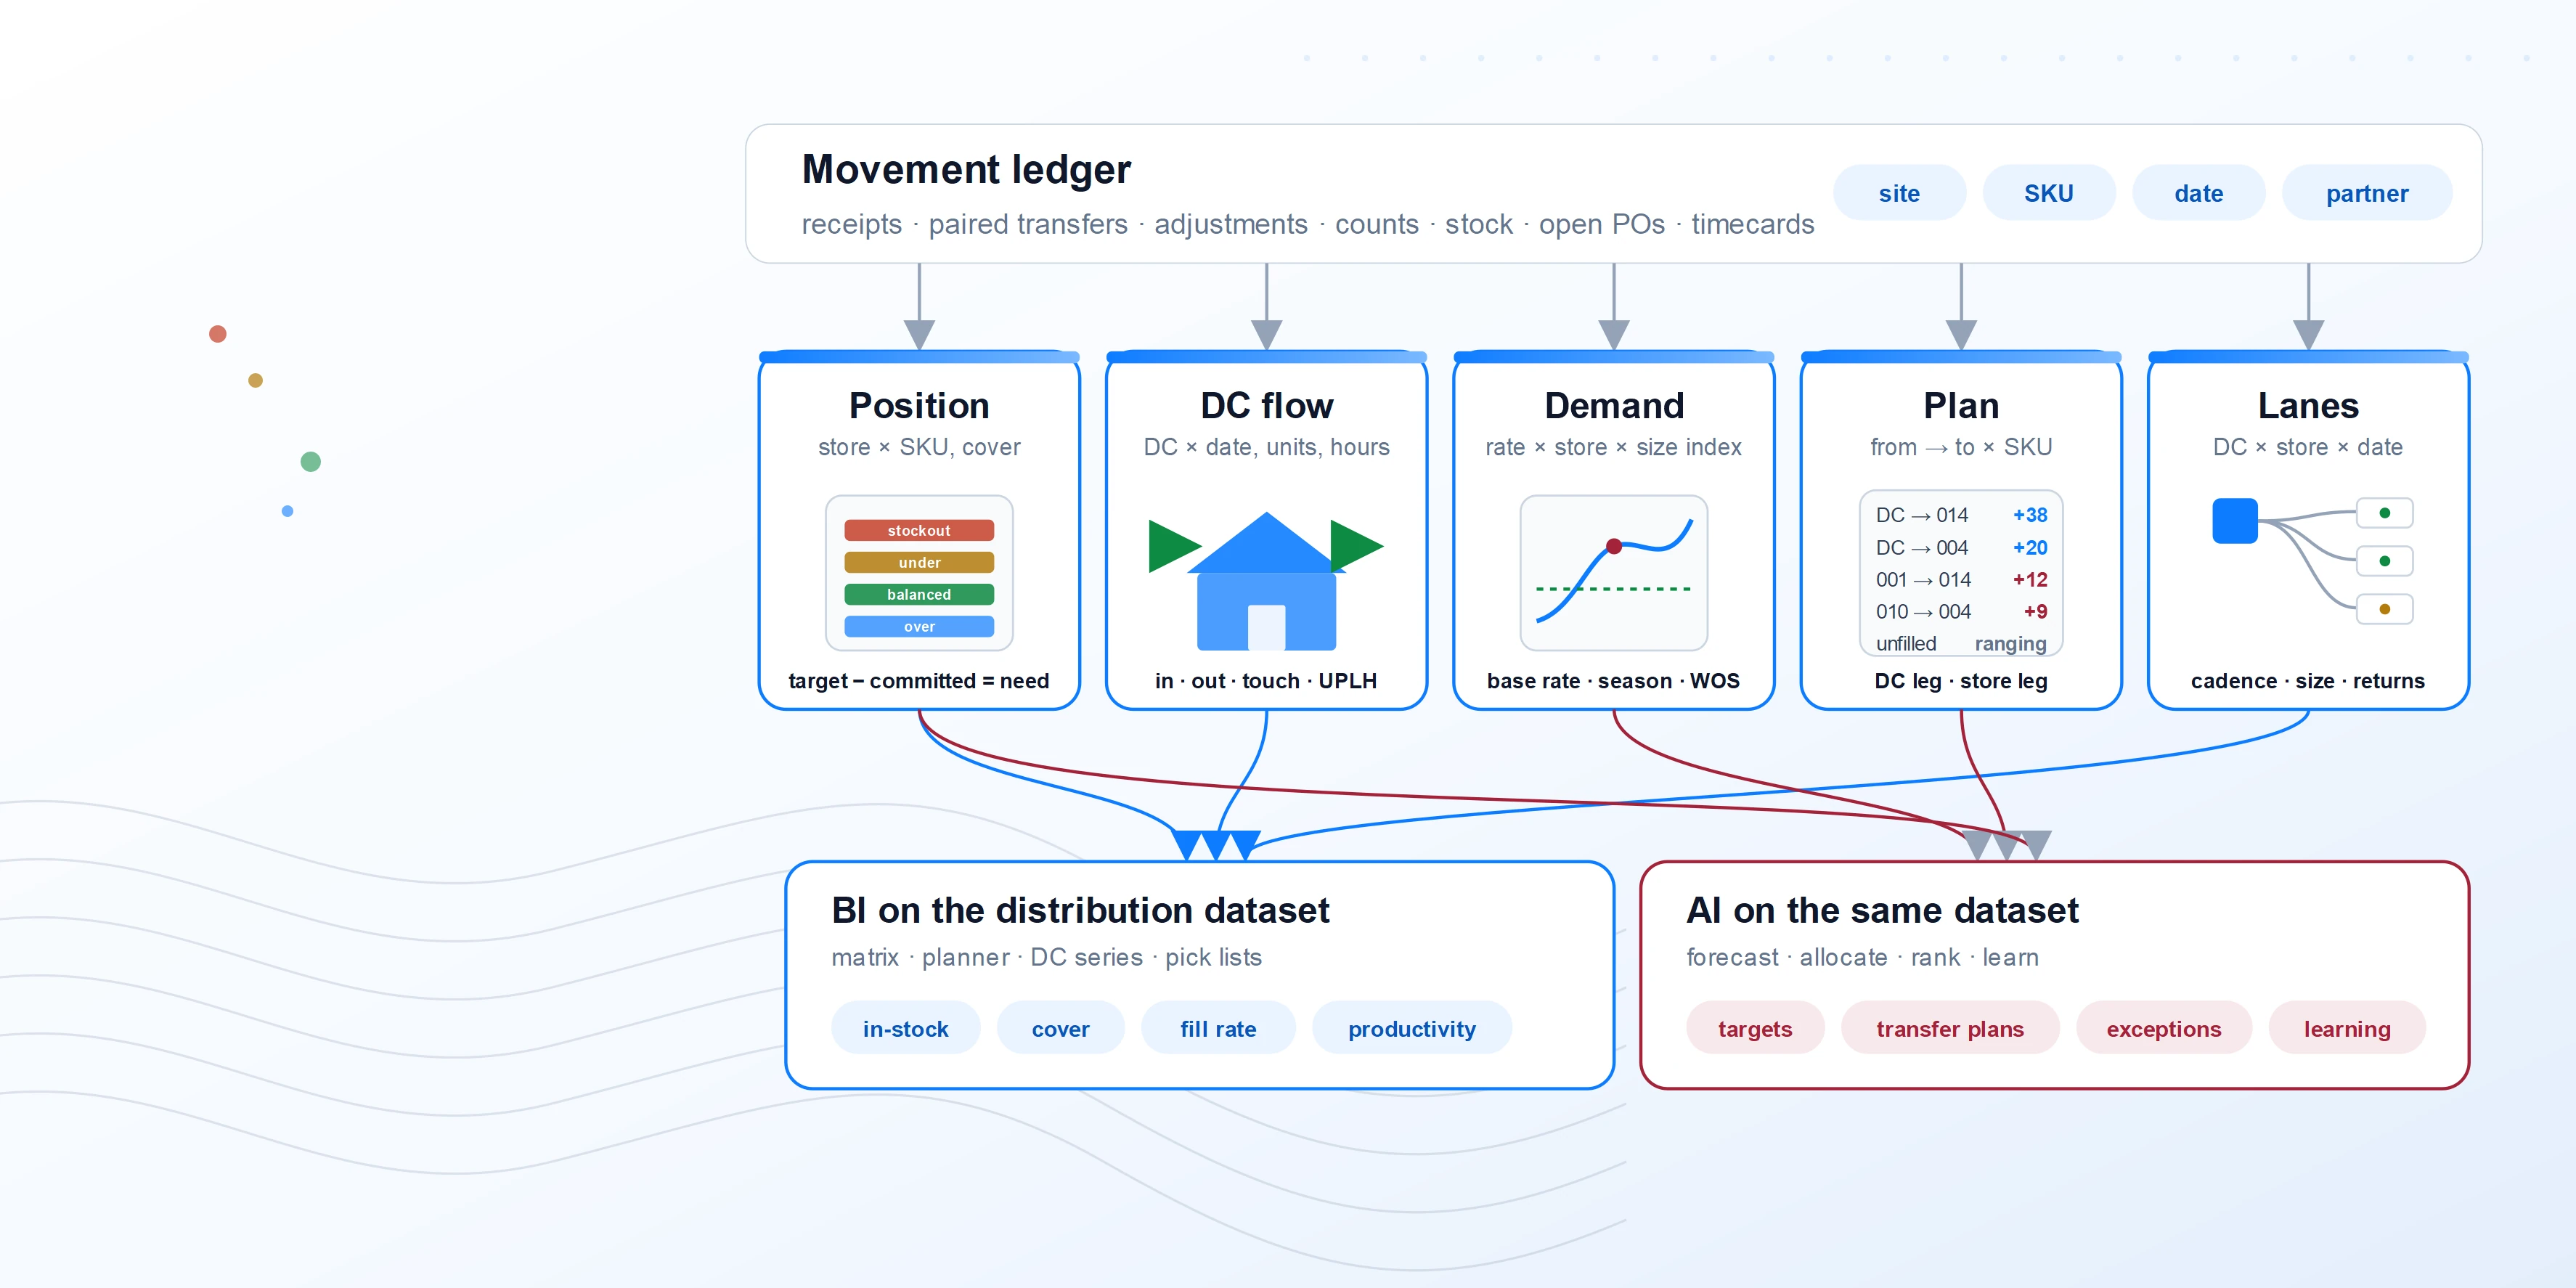
Figure: the five facts share site, SKU and date, so a planner's screen, a DC report and an allocation run all point at the same position.
Generic dataset attributes
Attributes are grouped by role. BI marks the ones the matrix, planner and DC reports aggregate; AI marks the ones the forecasting and allocation engines consume. Most are both.
Store position
| Group | Attributes | Notes | Used by |
|---|---|---|---|
| Identity | Site, SKU, Style, Colour, Size, Department, Class, Vendor, Season, Category, Price, Regular price, Cost | SKU is the allocation grain; style and colour are the demand grain; size joins the two through the size index. | BIAI |
| Site attributes | Site type (store, DC, web), Region, District, Cluster, Model store, Allocation eligible, Ranged for SKU, Floor capacity | Eligibility lives on the location, not in a report filter, so an excluded store is never allocated to and then hidden. | BIAI |
| Stock | On hand, On hand floored at zero, On purchase order, Inbound transfer, Outbound transfer, Committed stock, Minimum on hand, DC on hand for the SKU | Committed = floored on hand + on PO + inbound. Negative on hand is a data condition, never a demand signal. | BIAI |
| Demand at the store | Weekly rate at store, Cover weeks, Safety weeks, Target on hand, Weeks of supply (committed cover), Weeks in stock | Rate = chain rate × store index × size index. WOS means weeks of cover at that store, so the store index is mandatory. | BIAI |
| Position state | Deficit, Surplus, Stockout flag, Understocked, Balanced, Overstocked, Phantom deficit flag, Negative stock flag | Bands by cover: under target, 4 to 12 weeks, beyond 12 weeks. A phantom deficit is one created by negative on hand rather than by demand. | BIAI |
| Value | Retail on hand, Cost on hand, Unmet demand at retail, Overstock at retail | Valued at regular price for the case, at cost for the balance sheet. | BI |
DC flow
| Group | Attributes | Notes | Used by |
|---|---|---|---|
| Identity | DC, Activity date, Day of week, Movement type, Reference document, Line, Counterparty site, Counterparty channel (store, web, DC), Network shipment flag | Direction comes from the sign at the site, not from the type: transfers are two-sided and a DC's outbound may carry either label. | BIAI |
| Inbound | Receipt units, Receipt lines, Receipt documents, Receipt reversal units, Returned from store units, Transfer in from DC units | Vendor receipts have no second leg and sum freely across DCs. | BI |
| Outbound | Shipped to store units, lines, documents, Destinations served, Transfer out to DC units, Web fulfilment units | Shipped-to-store is network-safe. Inter-DC moves appear at both ends and are never summed across DCs. | BIAI |
| Corrections | Adjustment units (net), Count variance units (net), Correction count | Reported, but excluded from touch units: they are corrections, not throughput. | BI |
| Labour | Paid hours, Direct hours, Indirect hours, Headcount days, Hours by work area (receiving, putaway, picking, prep, decoration, indirect), Shift, Labour cost | Shift is inferred from punch-in time; unmapped activities fall to indirect by design. | BI |
| Productivity | Touch units, Units per labour hour, Receiving rate, Picking rate, Utilisation (direct ÷ paid), Cost per unit | Compare a DC with its own history; work-area booking conventions differ between sites. | BIAI |
| Service (WMS) | Demand units, Allocated units, Open units, Demand orders, Complete orders, On-time orders, Unit fill %, Order fill %, On-time ship % | Reserved columns. They populate when the WMS distribution module supplies order and line grain; a movement ledger cannot infer them. | BIAI |
Demand features
| Group | Attributes | Notes | Used by |
|---|---|---|---|
| Identity | Style, Colour, Season code, Lifecycle stage, First received, Weeks in stock | Weeks in stock caps the averaging window so a new style is not divided by weeks it did not exist. | AI |
| History | Weekly units for the trailing year (W1 onward), Trailing 4, 13, 26 and 52-week totals, Markdown units | The week in progress is never used: it is incomplete and lagging by construction. | BIAI |
| Rate | De-seasonalised base weekly rate, Seasonality index by week, Forward factors for 4, 13 and 26 weeks, 52-week forecast | Base = average of recent complete weeks ÷ their seasonal weight. The 52-week horizon carries no factor because it spans one full cycle. | AI |
| Apportioning | Store index per style, Size index per style, Cluster index | Both indices sum to one per style, so store, colour and size grains roll up consistently. | AI |
| Supply context | Lead time (weeks), Vendor, DC ranged flag, Direct-to-store flag | Separates what a DC can ship from what must be bought or ranged. | BIAI |
Allocation plan
| Group | Attributes | Notes | Used by |
|---|---|---|---|
| Identity | Run id, Run date, Parameters (cover weeks, safety weeks, minimum transfer units, lookback weeks, state and source filters), Leg (DC to store, store to store) | Every plan is reproducible from its parameters. Legs are separate columns downstream, never netted. | BIAI |
| Pair | From site, To site, SKU, Style, Colour, Size, Deficit at receiver, Surplus at source, Suggested quantity, Priority, Capped flag | Quantity is the overlap of source surplus and receiver deficit laid on a cumulative axis, so both sides are capped in one pass. | BIAI |
| Outcome | Fill rate, Filled units, Unfilled deficit, Reason unfilled (not ranged at DC, direct-to-store, DC short, below minimum transfer) | The unfilled reasons are the ranging and buying agenda, and they are the bigger number. | BI |
| Execution | Pick list id, Transfer document, Shipped quantity, Received quantity, Status (proposed, picked, shipped, received, cancelled) | Links the plan row to the WMS document so the loop closes. | BIAI |
Replenishment lane
| Group | Attributes | Notes | Used by |
|---|---|---|---|
| Identity | DC, Destination site, Activity date, Region, Store type, Pick zone | One row per lane and day; both directions carried so returns are visible next to shipments. | BI |
| Volume | Shipped units, lines, documents, Returned units, Net units, Category split | BIAI | |
| Cadence | Days since last shipment, Shipments per week, Average shipment size, Lane rank | Cadence is what a planner tunes; the engine's minimum transfer units and cover weeks set it. | BIAI |
Functional areas and what each reads
| Functional area | Reads | Deciding attributes | BI output | AI output |
|---|---|---|---|---|
| DC distribution | Position, Demand, Plan (DC leg) | Target on hand, deficit, DC on hand, ranged flag, priority | Distribution matrix by style, colour, district and store; pick lists by DC | Allocation quantities per store and SKU against forecast need; who gets stock first when the DC is short |
| Store rebalancing | Position, Plan (store leg) | Surplus, deficit, minimum transfer units, source and receiver eligibility | Re-allocation matrix, transfer pairs, conservation check (nets to zero) | Paired transfers with priority; suppression of moves below cost of handling |
| Store stock planning | Position, Demand | Weekly rate at store, WOS, inbound, on PO, size index | Planner screen by style, colour and size tile with proposed actions | Recommended target per store and size; explanation of the gap |
| Size and store indexing | Demand features | Store index, size index, cluster, seasonality | Size curve by blank, colour and model; store share tables | Index refresh; detection of broken size runs before they cost sales |
| Ranging and buying | Plan outcome, Demand | Reason unfilled, DC ranged flag, lead time, 13-week forecast | Unfilled deficit by reason; DC-ranged versus direct-to-store | Suggested purchase quantities where distribution cannot fill |
| DC productivity | DC flow, Lanes | Touch units, hours by work area, destinations served, cadence | Executive flash, inbound receiving, picking productivity, labour utilisation, flow by department, vendor, destination and style | Labour demand forecast per DC and shift from planned outbound |
| Exception management | Position, Plan | Negative stock, phantom deficit, unranged SKU, capped transfer, hidden store | Exception queues with counts and units | Ranked exceptions with the correction that clears the most units |
| Service and fill | DC flow service columns | Demand versus allocated, open units, on-time orders | Unit fill, order fill, on-time ship, backlog ageing | Predicted shortfall by lane before the wave is released |
Rules the dataset carries
Conservation and direction
- Redistribution nets to zero. A store-to-store plan has a negative at the source for every positive at the receiver. The grand total of the redistribution column is always zero; if it is not, the plan is wrong.
- DC receipts are their own column. A unit shipped from a DC has no negative counterpart inside a store-only grid, so netting the DC leg into the redistribution column breaks the balance by exactly the DC volume.
- Transfers are paired. Every transfer writes two rows. Direction is the sign at the site; the counterparty is the other end of the pair, not "the destination when negative".
- Inter-DC moves count at both ends. They are real work at each DC and are kept at site grain, in their own columns, excluded from every network total.
Demand and cover
- One rate, apportioned. Store rate = chain base rate × store index × size index. Nothing in the suite derives its own rate from raw movement or sales rows.
- Never the week in progress. The base rate averages completed weeks only, over weeks the style was actually in stock.
- Cover is committed cover. Weeks of supply divides committed stock (floored on hand + on PO + inbound) by the store rate, so a receiver is judged on what it will have, not on what it holds today.
- Negative stock is a condition, not a demand. On hand is floored at zero before need is computed and the position is flagged, so a miscount cannot pull stock out of a DC.
Eligibility and execution
- Eligibility on the location. Excluded or model stores are flagged on the site record and respected inside the engine, never filtered out of a view after stock has been allocated to them.
- DC leg before store leg. Warehouse stock fills deficits first; only the remainder is offered for rebalancing, so stores are not asked to ship what the DC already holds.
- A plan is not a transfer. Plan rows become pick lists, and pick lists become WMS transfer documents; the plan carries the document id back so fill is measured against what actually shipped.
Process workflow
The distribution week is a loop. The Hub runs the left half unattended; planners and the DC run the middle; the AI layer closes it by measuring what shipped against what was planned.
Cadence
| When | Step | Output | Owner |
|---|---|---|---|
| Continuous | Capture | Ledger current to the last receipt and transfer | POS, WMS, receiving |
| Nightly | Load, target | Positions, DC flow, demand features, exception flags | AI Data Hub |
| Per wave (daily or twice weekly) | Allocate, review, execute | Plan, pick lists, transfer documents | Allocation planner, DC manager |
| Weekly | Measure | In-stock, cover bands, fill rate, DC productivity | Allocation manager, DC manager |
| Monthly | Learn and tune | Index refresh, parameter review, ranging and buying list | Merchandise planning, data science |
Where BI ends and AI begins
BI on the distribution dataset
AI on the same dataset
Both read the same five facts. A deficit a planner sees in the matrix is the row the engine filled or left unfilled, and the reason it left it is the row the buyer sees next.
What a conforming dataset delivers
The DC leg actually runs. Warehouse stock is allocated against forecast need instead of static minimums, and the units that were bought and sitting still reach the stores that sell them.
Balancing that balances. Store-to-store plans conserve units, respect eligibility and stop at the cost of handling, so the matrix and the pick list agree.
The unfilled number is the agenda. Deficits the DC cannot fill are attributed to ranging, buying or direct-to-store, so distribution and purchasing work from one list.
Deployment approach
Map movement types, transfer pairing, site flags (DC, web, model, eligible) and the calendar. Confirm which SKUs each DC ranges and which merchandise ships direct to store.
Build the store position and DC flow facts and the demand features. Tie DC flow to the movement ledger exactly, and the position to the stock ledger and open orders.
Run the engine on live parameters, prove conservation and the DC-before-store order, and publish the distribution, re-allocation, planner and DC report sets.
Connect plan rows to pick lists and WMS transfer documents, switch on fill and service measures where the WMS supplies order grain, and start the monthly index and parameter review.