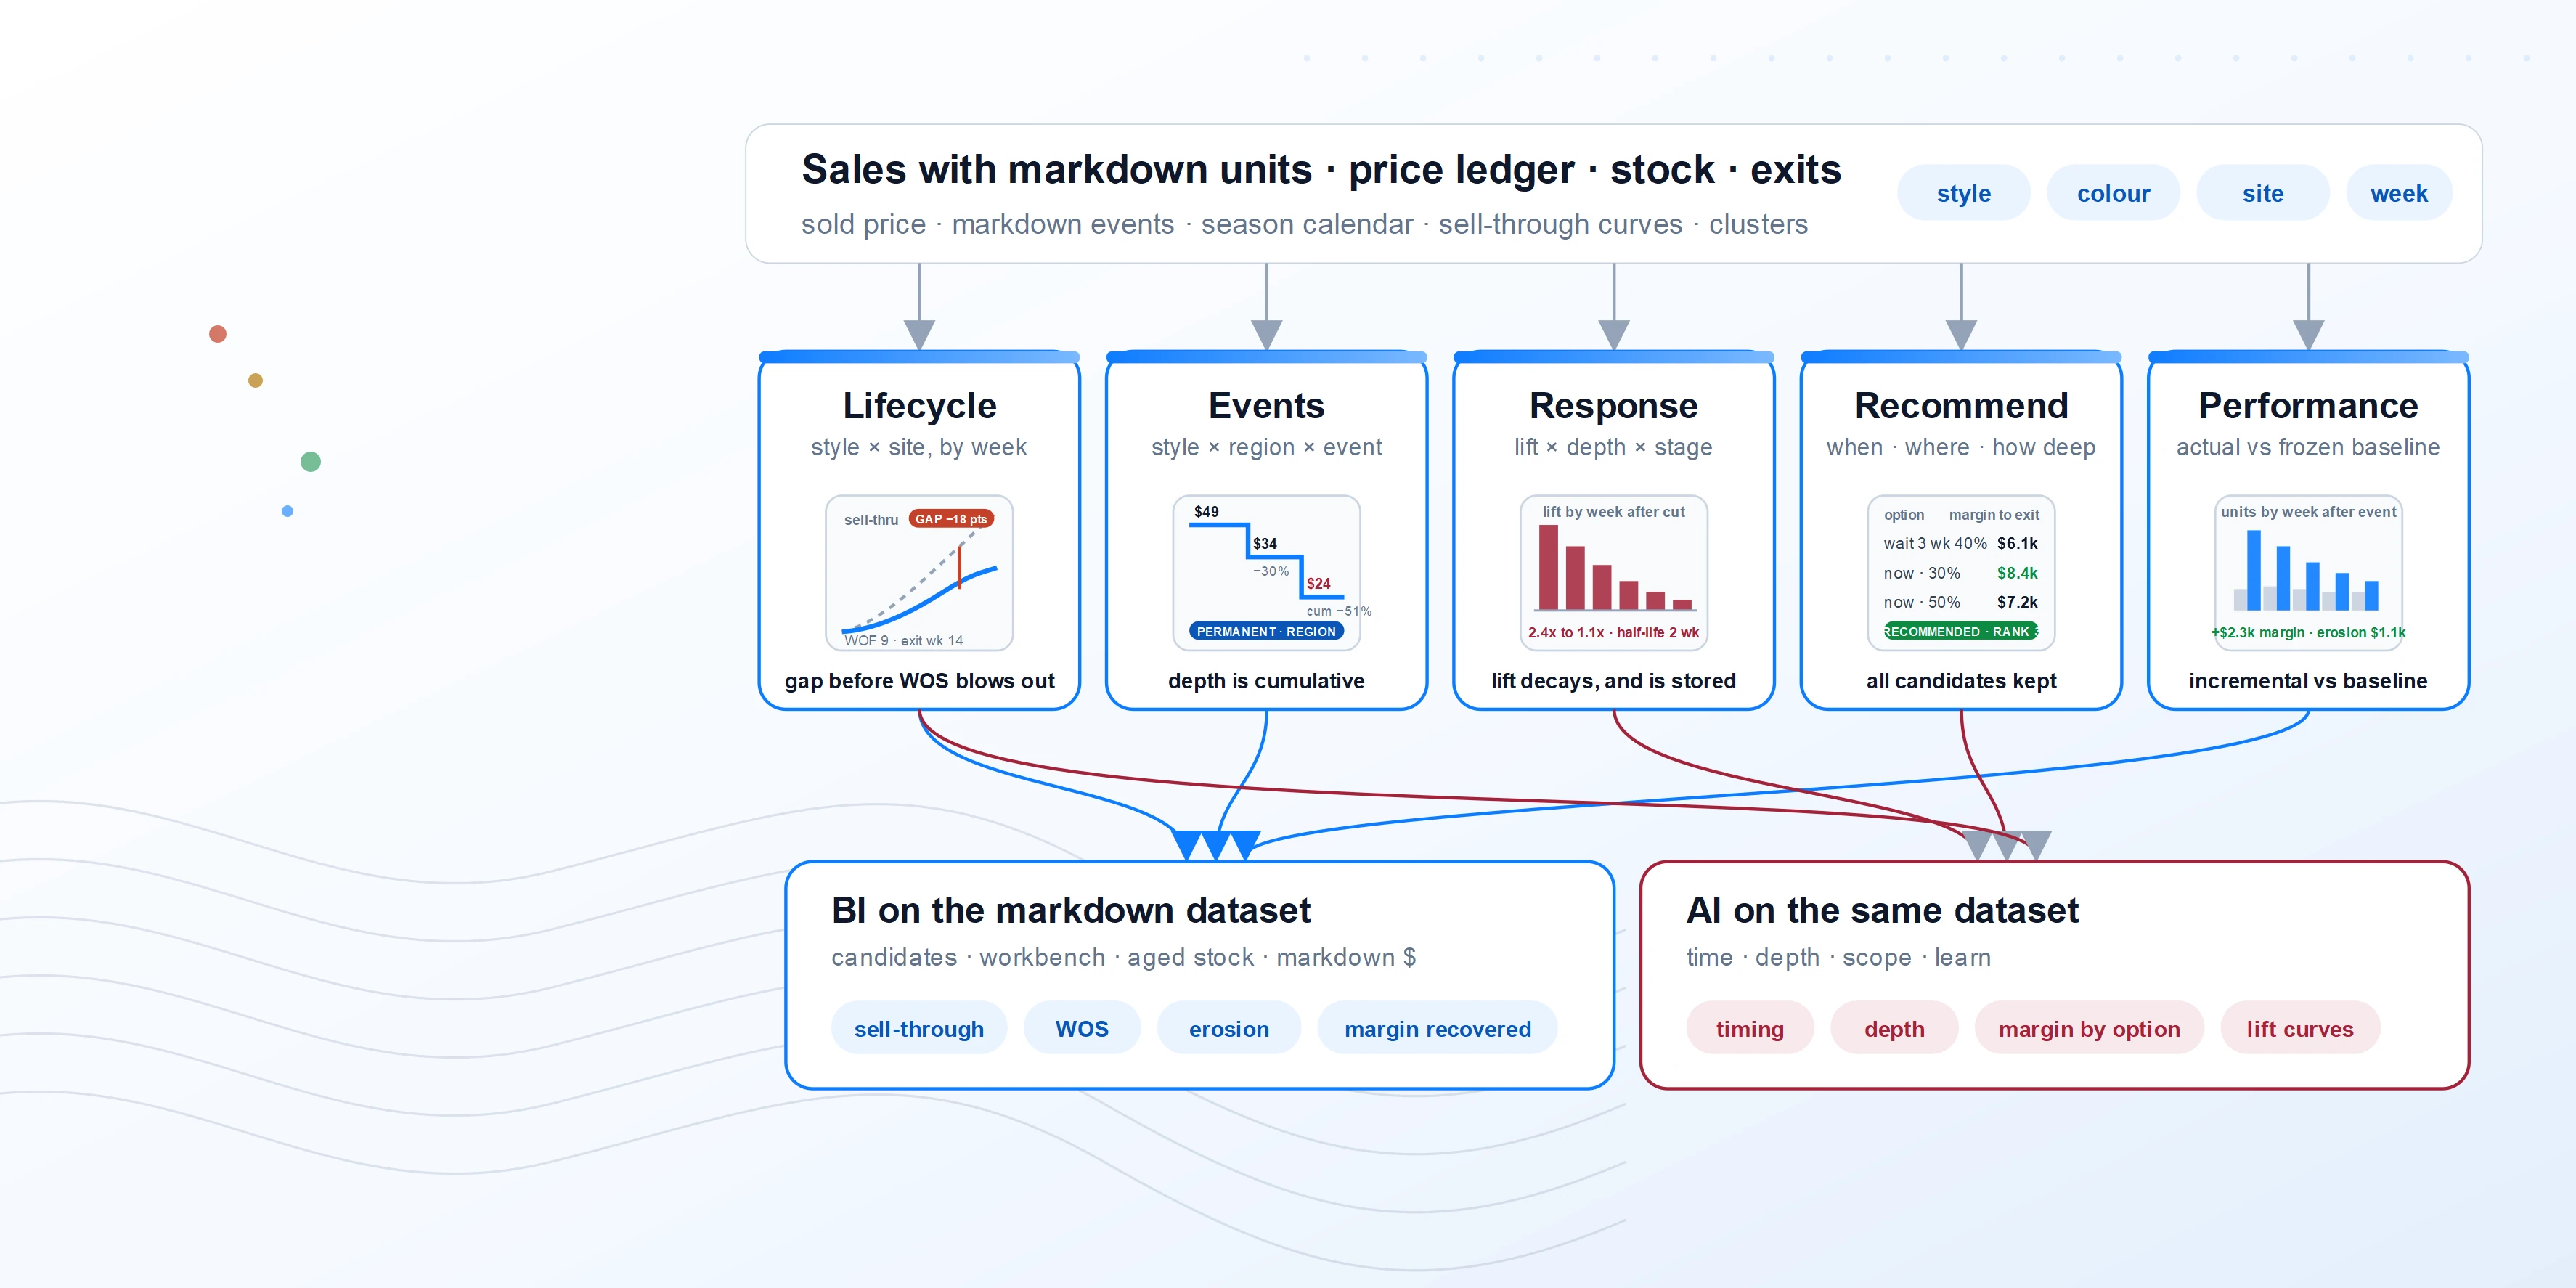
A markdown is a decision about time, not just price
The cost of a markdown is rarely the depth. It is the weeks a style sat at full price after demand had already moved on, and the weeks it sat at a shallow first cut that did not move it either. The information needed to act earlier already exists: weeks on floor, sell-through against a curve, weeks of supply at the current rate, and what similar styles did at each depth. A markdown dataset stores those things per style and site so the question changes from "how deep" to "when, where, how deep, and what did it recover".
The Cybex Markdown Optimization dataset is five facts on one style and colour and one site or price region. It sits downstream of the pricing dataset, which owns the price ledger and the promotion calendar, and beside the replenishment dataset, which owns stock status and the sales rate. This one owns the lifecycle position, the markdown event as it was taken, the demand response the engine learned, the recommendation it made, and the performance that followed. Nothing here is specific to one retailer: price regions, clusters, markdown types and season codes are mapped to generic values at load time.
Five facts, one style and one site
| Fact | Grain | Question it answers | Loaded from |
|---|---|---|---|
| Lifecycle position | One row per style and colour per site, as of a week | How long has it been out, how much has sold, how long will the rest take, and when must it be gone? | Stock status, sales rate, first and last receipt, season calendar, ABC, exit dates |
| Markdown events | One row per style and colour per price region (or site) per event | What was the price, what is it now, how deep, from when, of what kind, and who approved it? | Price ledger, markdown workbench, POS markdown tables, clearance schedules |
| Demand response | One row per style and colour (or class and cluster) per candidate depth and stage | What happens to the rate at this depth, at this point in the life, in this cluster? | Sales history across past markdown events, seasonality, lifecycle stage, cluster |
| Markdown recommendation | One row per run, style and colour, site or region, and candidate | When, where and how deep should the cut be, and what margin does each option keep? | Lifecycle position, demand response, exit date, stock, OTB and clearance targets |
| Markdown performance | One row per style and colour, site and week after the event | Did it move, what was the erosion, what margin was recovered against doing nothing? | Sales fact with markdown units, sold price, baseline forecast, stock after |
Figure: the five facts share style and site; the event row is the truth of what was done, and performance is measured against a stored baseline, not against the week before.
Generic dataset attributes
Attributes are grouped by role. BI marks the ones the candidate, workbench and performance reports aggregate; AI marks the ones the response model and the timing engine consume. Most are both.
Lifecycle position
| Group | Attributes | Notes | Used by |
|---|---|---|---|
| Identity | Style, Colour, Site, Price region, Cluster, Department, Class, Vendor, Season code, Category, Lifecycle stage, As-of week | Stage is derived from the season calendar and weeks on floor: launch, core, late, clearance, exit. | BIAI |
| Age | First received, Last received, Last sale, Weeks on floor, Weeks in stock, Planned exit date, Weeks to exit, Season end | Weeks to exit is the horizon every recommendation is sized against; a style with no exit date is flagged, not defaulted. | BIAI |
| Position | On hand, On hand at retail and cost, On order, Units sold to date, Units received to date, Sell-through %, Weeks of supply at current rate, Cover band, Stock-to-sales | Sell-through is sold ÷ received; WOS uses the de-seasonalised rate from the replenishment dataset. | BIAI |
| Rate | Sales rate (units per week), Weekly units W1 to W6, Rate trend, Expected sell-through curve for the class and season, Sell-through gap versus curve | The gap against the curve is the earliest signal a style is slow; it appears before WOS blows out. | BIAI |
| Value | Current retail, Unit cost, Cumulative gross margin, Margin at risk if unsold, ABC rank, Full-price share of sales, Markdown taken to date | Margin at risk is what the exit-date rule would destroy; it ranks the candidate list. | BIAI |
Markdown events
| Group | Attributes | Notes | Used by |
|---|---|---|---|
| Identity | Event id, Style, Colour, Scope (site, price region, cluster, chain), Site list, Event sequence (first, second, final), Type (permanent, temporary, clearance, POS), Created by, Approved by, Source run id | Scope is stored explicitly; a region event expands to sites at load so performance can be read at both grains. | BIAI |
| Price | Old retail, New retail, Markdown amount, Markdown %, Effective date, End date (temporary), Reversal flag, Cumulative depth from original retail | Cumulative depth is from the first-ever retail, so a second cut is judged on the total, not the increment. | BIAI |
| Stock at event | On hand at event, On hand at retail, Erosion at event (units × amount), Weeks on floor at event, Sell-through at event, WOS at event | The erosion booked at the event is the accounting number; the sales-side erosion is measured separately in performance. | BI |
| Reason | Reason code (slow, seasonal exit, damaged, competitor, planned cadence), Recommendation accepted flag, Deviation from recommendation (timing, depth) | Deviation is what the learning loop uses to compare taken versus recommended outcomes. | BIAI |
Demand response
| Group | Attributes | Notes | Used by |
|---|---|---|---|
| Identity | Scope level (style, class and season, class and cluster, department), Style or Class, Cluster, Lifecycle stage, Candidate depth band (10, 20, 30, 40, 50, 60+), Model version, Fitted date | Response is fitted at the most specific level with enough history and falls back to the class, with the level recorded. | AI |
| Lift | Baseline weekly rate, Rate at depth, Lift multiple, Elasticity, Lift decay by week after the cut, Half-life of the lift, Confidence, Observations | Lift decays; a cut that doubles the rate in week one is back near baseline by week four, and the decay is stored. | AI |
| Context | Seasonality index by week, Promotion overlap flag, Competitor price signal, Traffic index, Stock breadth effect (sizes available) | A cut on a broken size run lifts less than one on a full run; breadth is a feature, not noise. | AI |
| Cannibalisation | Substitute styles, Share shift at depth, Halo on adjacent full-price styles, Net category lift | Category-level net lift is what the recommendation optimises; a style that steals from a full-price sibling is penalised. | AI |
Markdown recommendation
| Group | Attributes | Notes | Used by |
|---|---|---|---|
| Identity | Run id, Run date, Style, Colour, Scope (site, region, cluster), Candidate id, Recommended flag, Constraint set (min depth step, price points, max cuts, blackout weeks) | Every candidate is kept, not just the winner, so the planner can see what a shallower or later cut would have kept. | BIAI |
| Option | Timing (week), Depth %, New price point, Sequence position, Weeks to exit at start, Stock at start | Timing and depth are the two levers; price point rounds depth to the retailer's ladder. | BIAI |
| Projection | Projected units by week, Projected sell-through at exit, Residual units at exit, Projected revenue, Projected gross margin, Margin versus do-nothing, Margin versus deepest-immediate, Residual disposal cost | Margin over the remaining life, including the residual's disposal cost, is the objective; revenue and sell-through are shown but not optimised. | BIAI |
| Priority | Margin at risk, Days until the recommended week, Urgency band, Category clearance target contribution, Rank within department | Rank orders the workbench so the cuts that protect the most margin are reviewed first. | BI |
| Outcome | Planner decision (accepted, adjusted, deferred, rejected), Adjusted timing and depth, Reason, Event id created | Links the recommendation to the event it became, or the reason it did not. | BIAI |
Markdown performance
| Group | Attributes | Notes | Used by |
|---|---|---|---|
| Identity | Event id, Style, Colour, Site, Week after event (0 to n), Retail week, Event sequence | Week 0 is the event week; performance is read as a curve, not a single number. | BIAI |
| Sales | Units, Markdown units, Sales at sold price, Sales at old retail, Erosion (units × markdown amount), Discount below ticket, Gross margin, Returns | Markdown units come from the sales fact where the sold price was a marked-down ticket; erosion is measured, not booked. | BIAI |
| Baseline | Baseline units (do-nothing forecast stored at the event), Baseline margin, Incremental units, Incremental margin, Lift multiple realised, Realised versus projected | The baseline is frozen at the event so the comparison cannot drift as the forecast is refreshed. | BIAI |
| Stock | On hand after, Sell-through after, WOS after, Weeks to clear at new rate, Residual at exit, Next cut required flag | Answers whether the cut was enough or a second is coming. | BIAI |
| Rollup | Markdown % of sales, Erosion % of retail, Margin recovered, First-cut success rate, Average cuts per style, Weeks late versus recommendation, Clearance target attainment | The season-level scorecard by department, vendor and cluster. | BI |
RateAtDepth(d, week n) = BaselineRate × Lift(d, stage) × Decay(n) · CumDepth = 1 − NewRetail ÷ OriginalRetail
MarginOption = Σ weeks to exit (Units(n) × (Price(n) − Cost)) − Residual × DisposalCost · choose max over (week, depth)
Incremental = Actual − BaselineFrozenAtEvent · Erosion = MkdnUnits × (OldRetail − NewRetail)
Functional areas and what each reads
| Functional area | Reads | Deciding attributes | BI output | AI output |
|---|---|---|---|---|
| Slow-seller detection | Lifecycle | Sell-through gap, weeks on floor, WOS, weeks to exit, margin at risk | Stock-sales analysis by class, style and SKU; aged stock by vendor and department; candidate list | Early-warning score weeks before the WOS threshold trips |
| Markdown workbench | Recommendation, Lifecycle, Events | Candidates, projected margin by option, rank, price ladder, constraints | Markdown workbench by department, vendor and region; what-if by depth and week; approval trail | Recommended timing, depth and scope per style; margin by option |
| Markdown creation and scope | Events, Lifecycle | Scope, price region, cluster, site list, effective date, type | Markdown lists by region and site; event history per style; price and clearance schedules | Scope suggestion: which regions or clusters to cut and which to hold |
| Clearance and exit | Lifecycle, Recommendation | Weeks to exit, residual at exit, disposal cost, clearance target | Exit calendar; residual projection by department; clearance target attainment | Cadence plan (first, second, final) that reaches exit with minimum residual |
| Erosion and margin | Events, Performance | Erosion at event, measured erosion, margin recovered, incremental margin | Markdown $ and % by department, vendor, class and site; erosion booked versus measured | Attribution of margin recovered to timing, depth and scope |
| Response learning | Performance, Events, Response | Realised lift, decay, deviation from recommendation, breadth | Lift curves by class and depth; first-cut success rate; weeks-late scorecard | Refreshed response model by class, stage and cluster; confidence by scope |
| Vendor and buy feedback | Performance, Lifecycle | Markdown % of sales by vendor, cuts per style, full-price share | Vendor markdown scorecard; class markdown history by season | Buy-depth and exit-date suggestions fed back to planning and assortment |
Rules the dataset carries
Position and events
- An exit date for every style. Weeks to exit is the horizon; a style without one is an exception on the workbench, not a style with infinite time.
- The event is the record. Old price, new price and date come from the markdown taken, never inferred from the first week a lower sold price appears.
- Depth is cumulative. A second cut is judged on the distance from original retail, so a 20 on a 30 is a 44, not a 20.
- Scope is explicit. Region and cluster events expand to sites at load; a site never inherits a markdown it was not in.
Response and recommendation
- Lift is fitted at the deepest scope with history. Style first, then class and cluster, then class; the level used is stored with the number.
- Lift decays. The response is a curve by week after the cut; a single lift multiple overstates every markdown after its first week.
- Margin to exit is the objective. Revenue and sell-through are reported; the option chosen is the one that keeps the most margin after residual disposal.
- All candidates are kept. The planner sees the cost of waiting and the cost of going deeper, not just the winner.
Performance
- Baseline frozen at the event. Incremental units and margin compare against the do-nothing forecast stored when the cut was taken.
- Erosion booked and erosion measured are both kept. Accounting needs the event-time number; learning needs the units that actually sold at the lower price.
- Markdown units come from the sales fact. A unit is a markdown unit when its sold ticket was a marked-down retail, so the count ties to sales audit.
- Deviation is recorded, not judged. A planner's override is a data point for the model, and the outcome is attributed to the decision as taken.
Process workflow
The markdown cycle is weekly for detection and recommendation, with events created on the retailer's price-change calendar. The Hub runs the left half unattended; buyers and planners run the workbench; the AI layer times and sizes the cut ahead of the review and measures it behind.
Cadence
| When | Step | Output | Owner |
|---|---|---|---|
| Continuous | Capture | Sales, sold price, stock and price ledger current to the last transaction | POS, e-commerce, pricing |
| Weekly | Position, detect, recommend | Lifecycle position, candidate list, recommendations with margin by option | AI Data Hub |
| Weekly | Workbench review | Accepted, adjusted and deferred candidates with reasons | Buyers, merchandise planning |
| Price-change calendar | Execute | Markdown events by scope; POS and web prices; erosion booked | Pricing, store operations |
| Weekly | Performance review | Lift, erosion, margin recovered, residual and next-cut flags by department | Merchandise planning, finance |
| Season end | Learn and feed back | Response model refresh; vendor and class markdown scorecards; buy-depth and exit-date suggestions | Planning, data science |
Where BI ends and AI begins
BI on the markdown dataset
AI on the same dataset
Both read the same five facts. The sell-through gap a buyer sees on the workbench is the one the candidate was scored on, and the margin recovered in the scorecard is measured against the baseline that recommendation stored.
What a conforming dataset delivers
Earlier, shallower, fewer. Slow sellers are seen at the sell-through gap rather than the WOS blow-out, so the first cut is earlier and more often the only cut.
Every cut with its alternatives. The workbench shows what waiting or going deeper would have kept, so an override is an informed one and is recorded as such.
Margin recovered, measured honestly. Performance against a baseline frozen at the event, with erosion booked and erosion measured both on the page.
Deployment approach
Map the price ledger, the markdown tables and workbench, price regions and clusters, the season calendar and exit dates; confirm markdown units are carried on the sales fact and how sold price relates to ticket.
Build the lifecycle position with sell-through curves by class and season, and the event fact from history with cumulative depth and scope expansion. Publish stock-sales analysis, aged stock, event history and markdown $ by department.
Fit lift and decay by class, stage and depth from past events; run candidates to exit with margin by option; publish the workbench with rank, constraints and the approval trail; prove projections tie to the position and the price ladder.
Freeze baselines at the event, measure weekly performance and residual, connect recommendations to events; start the response refresh and the vendor and class scorecards that feed planning and assortment.