Sales is the result. Traffic, conversion and labour are the levers.
A store's sales number is the end of a chain: people walked in, some of them bought, each buyer bought so many items at such a price, and staff were there to make it happen. A dataset that only stores the sales figure can report the result and nothing else. A store operations dataset stores every link of the chain, per store, per day and per hour, beside the plan for each, so the lever that moved is visible.
The Cybex Store Operations & Traffic dataset is five facts on one store-and-date identity. Two of them hold the trading record at day and hour grain; one holds people; one holds the forward view of traffic and the staff it needs; one rolls the week up for the workforce conversation. Nothing on this page is specific to one retailer: door-counter feeds, POS ticket rules, timecard activity codes and the retail calendar are mapped to the generic values at load time.
Five facts, one store and date
| Fact | Grain | Question it answers | Loaded from |
|---|---|---|---|
| Store day | One row per store and calendar day | How did the store trade against plan and last year, and with how many hours? | Ticket fact, door counters, timecards, weekly budget spread to days, retail calendar |
| Store hour | One row per store, date and hour | When do customers arrive, when do they buy, and who was on the floor? | Ticket fact by hour, door counters by hour, timecard punches, planned staff by hour |
| Employee performance | One row per store, employee and hour (rolls to day, week, region) | Who sold what, to how many customers, with what attach rate? | Ticket fact with till operator and primary seller, product flags, timecards |
| Traffic forecast | One row per store, date and hour, forward | How many visitors are expected, and how many staff does that need? | Traffic history, seasonality index, day-of-week profile, staffing ratios |
| Weekly workforce | One row per store and retail week, history and forecast | Are visits, conversion, hours and productivity moving together or apart? | Store day rolled to the week, last-year week aligned, plan and forecast weeks |
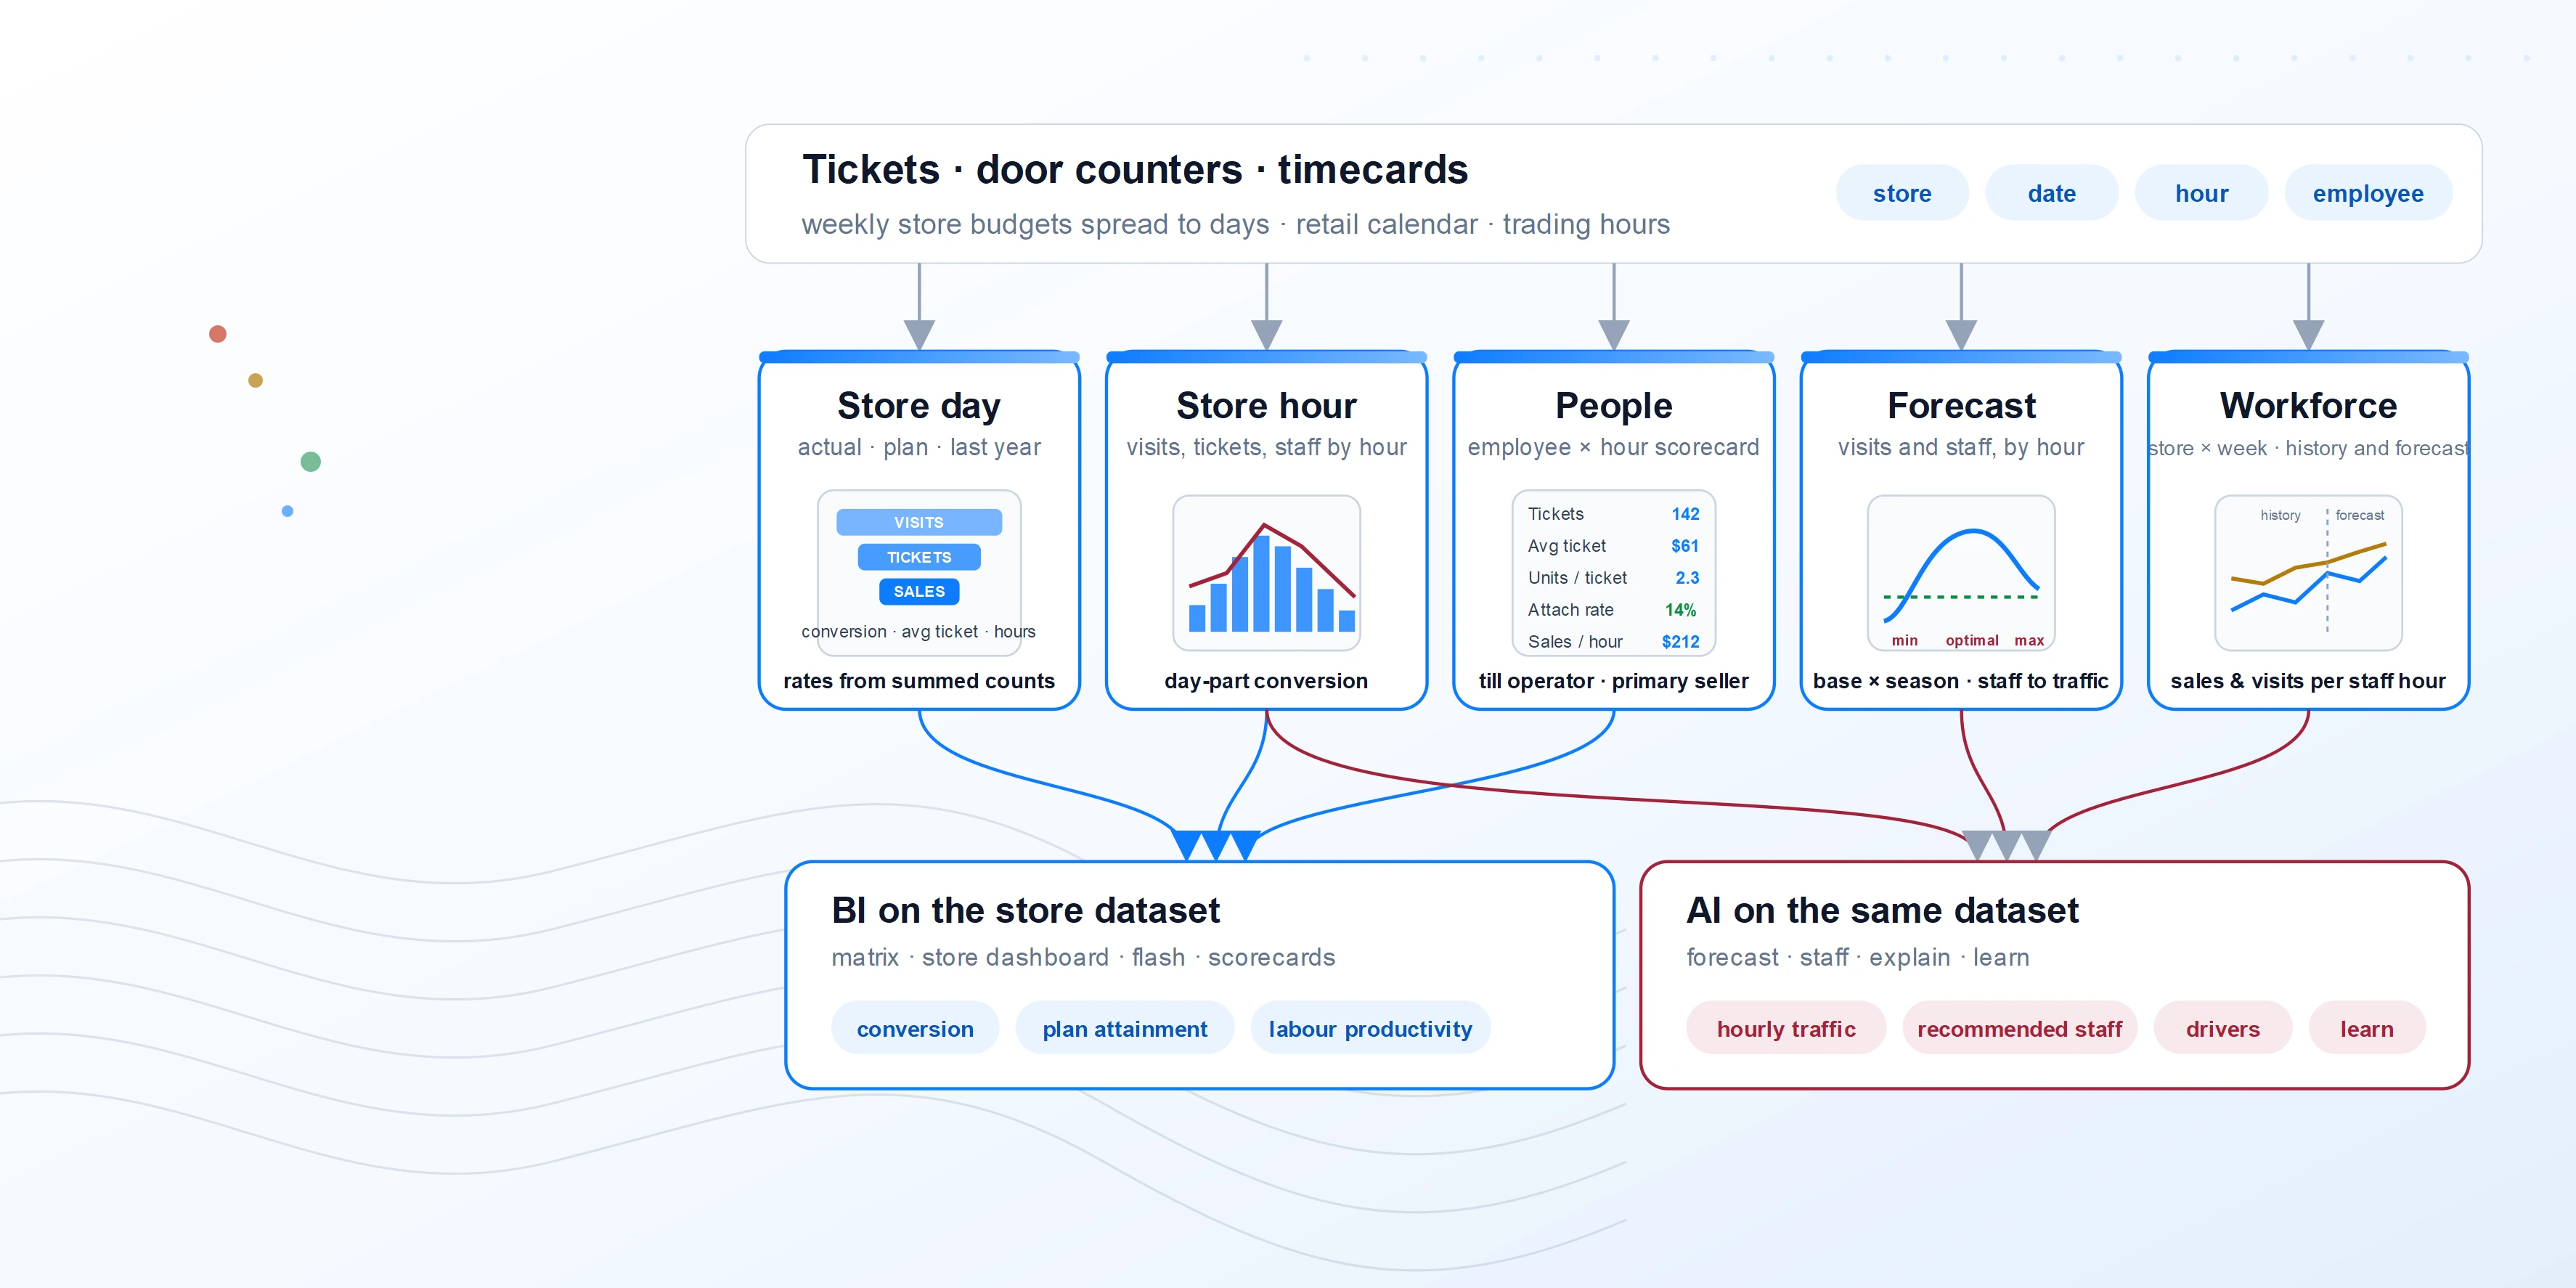
Figure: the five facts share store and date; hour and employee sit beneath, and the week rolls up from the day so every level reconciles.
Generic dataset attributes
Attributes are grouped by role. BI marks the ones the matrix, dashboard and scorecard reports aggregate; AI marks the ones the forecasting and staffing engines consume. Most are both.
Store day
| Group | Attributes | Notes | Used by |
|---|---|---|---|
| Identity | Store, Date, Retail year, Retail week, Retail period, Day of week, Week label, Elapsed flag, Store type (store, DC, head office, web), Region, District, Floor area, Door-counter flag | Warehouses and head office carry hours but no traffic or plan; they are excluded from store measures by type, not by list. | BIAI |
| Actuals | Sales, Units, Tickets, Visits, Staff hours, Cashiers on duty, Returns, Discount | Sales, units and tickets from the ticket fact; visits from the counter feed; hours from timecards over the full range, never a trailing window. | BIAI |
| Plan | Plan sales, Plan units, Plan tickets, Plan visits, Plan staff hours, Budget (legacy money plan) | Five budgeted measures; every other plan ratio is reconstructed from them. Plan columns are typed like their actuals and are never written into the actual columns. | BIAI |
| Last year | Sales LY, Units LY, Tickets LY, Visits LY, Staff hours LY | Same retail week and weekday one year back, so comparisons hold on the 4-5-4 calendar. | BI |
| Derived | Conversion %, Sales per visit, Average ticket, Units per ticket, Sales per staff hour, Visits per staff hour, Plan attainment %, Growth vs LY %, Comp flag | Computed in the presentation view from summed counts. Conversion is NULL, not zero, where the store has no counter. | BIAI |
| Data quality | Tickets-to-source parity, Visits without tickets flag, Hours without sales flag, Load timestamp | A site-day with door count but no tickets is an ETL gap until proven otherwise; the flag stops it reading as a conversion collapse. | BI |
Store hour
| Group | Attributes | Notes | Used by |
|---|---|---|---|
| Identity | Store, Date, Hour, Day of week, Trading-hours flag, Open and close hour | Hours outside the store's trading window are kept and flagged; they matter to audit and to staffing, not to conversion. | BIAI |
| Actuals | Sales, Units, Tickets, Visits, Cashiers active, Staff on floor (from punches), Sellers active | Cashiers and sellers are distinct counts: a cashier rings, a seller is credited. | BIAI |
| Plan | Plan visits by hour, Plan staff by hour | Spread from the day plan by the store's hourly traffic profile. | BIAI |
| Derived | Conversion by hour, Sales per hour, Visits per staff, Tickets per cashier, Weight (hour's share of the day's visits) | Weight is the profile used to spread day plans and forecasts to hours. | BIAI |
Employee performance
| Group | Attributes | Notes | Used by |
|---|---|---|---|
| Identity | Store, Employee, Role, Home store, Date, Hour, Till operator flag, Primary seller flag | A ticket has one till operator and one primary seller (the associate with the largest share of its sales); both are kept. | BIAI |
| Selling | Tickets, Sales, Units, Returns, Discount, Average ticket, Units per ticket, Hours worked, Sales per hour | Percentages are computed in the roll-ups from summed counts, never summed themselves. | BIAI |
| Programme measures | Eligible tickets (basket at or above threshold), Programme tickets, Programme units, Attach rate (programme tickets ÷ eligible tickets), Multiples, Tickets above value bands | The attach rate denominator is eligible tickets, not all tickets, so a store with small baskets is not penalised for them. | BIAI |
| Conversion | Visits during hours worked, Cashier conversion, Staff conversion, Visits per cashier | Individual conversion is a shared-floor estimate; report it by store and hour first, by person second. | BI |
| Roll-ups | By employee, By hour, By region, By store type | Each roll-up recomputes rates from its own summed counts. | BI |
Traffic forecast
| Group | Attributes | Notes | Used by |
|---|---|---|---|
| Identity | Store, Date, Hour, Week beginning, Forecast horizon, Forecast run | Forward by day and hour for the scheduling horizon; reproducible from the run id. | AI |
| Inputs | Base visits (de-seasonalised), Seasonality index by week, Day-of-week profile, Hour profile, Days with data, Events and closures | Base visits average completed weeks the counter was live; a week with partial coverage is weighted by its days with data. | AI |
| Output | Forecast visits, Peak visits, Average visits, Traffic level (low, normal, high, peak), Forecast tickets at planned conversion, Forecast sales | Sales forecast = forecast visits × planned conversion × planned sales per ticket, so a miss can be attributed to the lever that moved. | BIAI |
| Staffing | Visits per staff hour target, Minimum staff, Optimal staff, Maximum staff, Recommended staff by hour, Plan staff hours by day | Recommended staff is forecast visits over the target visits-per-staff-hour, bounded by floor minimum and capacity. | BIAI |
Weekly workforce
| Group | Attributes | Notes | Used by |
|---|---|---|---|
| Identity | Store, Retail week, Week beginning and ending, Data type (history, forecast), History and forecast windows | History and forecast weeks sit in one fact so a chart runs across the boundary. | BI |
| Volumes | Visits, Sales, Units, Tickets, Staff hours; each with LY and plan; Base visits, Season index, Season impact | Season impact = visits explained by the index versus the base, so a good week is separated from a seasonal one. | BIAI |
| Ratios | Conversion %, Sales per visit, Average ticket value, Units per ticket, Sales per staff hour, Visits per staff hour | Recomputed at week grain from the summed week. | BIAI |
AverageTicket = UnitsPerTicket × AverageUnitRetail
SalesPerStaffHour = Sales ÷ StaffHours · VisitsPerStaffHour = Visits ÷ StaffHours
Functional areas and what each reads
| Functional area | Reads | Deciding attributes | BI output | AI output |
|---|---|---|---|---|
| Traffic and conversion | Store day, Store hour | Visits, tickets, conversion, sales per visit, counter coverage | Conversion rate by store, day-part and weekday; visits versus LY; sales by store hour | Conversion driver analysis: traffic, staffing, weather, assortment and price effects separated |
| Plan attainment and comp | Store day, Weekly workforce | Plan sales, LY, comp flag, growth | Plan attainment, below-plan list, comp store trend, weekly and monthly trend, region and district roll-ups | Reforecast of the week from traffic run-rate; base-effect versus genuine-decline decomposition |
| Labour productivity | Store day, Store hour | Staff hours actual and plan, sales and visits per staff hour, hours without sales | Labour productivity by store and weekday; hours versus plan; sales per labour hour | Labour-to-demand alignment: where hours exceed or trail traffic by hour |
| Traffic forecasting and staffing | Traffic forecast | Base visits, seasonality, hour profile, staffing ratios | Forecast visits by store, day and hour; recommended staff; traffic level bands | Hourly traffic forecast; recommended minimum, optimal and maximum staff per hour |
| Employee scorecards | Employee performance | Sales, tickets, average ticket, units per ticket, attach rate, sales per hour | Store dashboard KPI tiles and grids by employee, hour and region; CSV export | Peer-normalised ranking; coaching flags where attach or ticket size trails the store |
| Programme performance | Employee performance, Store day | Eligible tickets, programme tickets and units, attach rate | Attach rate by store, employee and week; programme units | Attach-rate lift attribution and target setting by store |
| Store budgeting | Store day (plan) | Weekly budget for sales, hours, units, tickets, traffic, conversion | Store plan by week and month versus actual; reconstructed ratios | Store-level plan proposals from traffic trend and seasonality |
| Executive flash | Store day, Weekly workforce | Chain and store totals, growth, conversion, plan attainment | Daily and weekly flash; NRF-calendar comparisons; executive insight page | Narrative insights: what happened, why, and the lever to pull |
Rules the dataset carries
Counts before rates
- Rates are computed, never stored or averaged. Conversion, sales per visit and sales per staff hour are derived at each grain from that grain's summed counts. Averaging store conversions gives a number that belongs to no store.
- No counter, no conversion. A store without a door counter reports visits and conversion as NULL. Zero would be a store nobody entered.
- Attach rate over eligible baskets. Programme attach = programme tickets ÷ tickets at or above the basket threshold, so the denominator is the customers who could have attached.
Parity and calendar
- Each feed reconciles to its source per site-day. Tickets in the day fact must equal tickets in the ticket fact; a site-day with visits and no tickets is flagged as a load gap. Traffic and sales arrive on separate paths and one can lag the other.
- Hours are actual and full-range. Staff hours come from timecards across the whole history, not a trailing refresh window, so productivity is comparable across weeks.
- Scope by the retail calendar. Weeks, periods and years come from the calendar table; last-year aligns retail week to retail week, and January belongs to the year that started the previous February.
- Plans spread from weeks to days. The weekly budget is allocated across the seven calendar days; money is allocated in cents so it ties to the workbook to the penny.
Forecast and staffing
- Base then season. Traffic is de-seasonalised over completed weeks with counter coverage, then re-seasonalised forward; the week in progress never enters the base.
- Forecast the levers, not the result. Sales forecast is visits × conversion × average ticket, each carried separately, so a miss is attributed to one of them.
- Staff to traffic, bounded. Recommended staff = forecast visits ÷ target visits per staff hour, floored at the store minimum and capped at capacity; the target is a store attribute, not a report constant.
Process workflow
The store week is a loop. The Hub runs the left half unattended; store and district managers run the middle; the AI layer forecasts ahead of the schedule and explains the week behind it.
Cadence
| When | Step | Output | Owner |
|---|---|---|---|
| Continuous | Capture | Tickets, hourly counts and punches current to the hour | POS, counters, time and attendance |
| Nightly | Load, reconcile, forecast, recommend | Day and hour facts, parity flags, traffic forecast, recommended staff | AI Data Hub |
| Daily | Trade | Store dashboard and flash: sales, conversion, hours, attach against plan | Store manager |
| Weekly | Schedule and review | Next week's schedule; plan attainment, comp, productivity, scorecards | Store and district managers |
| Weekly | Executive flash | Chain growth, conversion, lost-transaction estimate, narrative insight | Operations leadership |
| Seasonally | Budget and tune | Weekly store budgets; seasonality, hour profiles and staffing ratios refreshed | Operations, finance, data science |
Where BI ends and AI begins
BI on the store dataset
AI on the same dataset
Both read the same five facts. The conversion a manager sees on the dashboard is the conversion the forecast assumed, and the hours the schedule committed are the hours productivity is judged on.
What a conforming dataset delivers
The levers, not just the result. Every store, day and hour carries visits, conversion, ticket size and hours beside the sales figure and the plan, so a miss is attributed on the day.
A schedule built from traffic. Staff recommendations by hour come from the store's own forecast and its own service ratio, and the week's productivity is measured against the hours that were committed.
Numbers that survive the roll-up. Rates are recomputed from counts at every level, feeds reconcile per site-day, and last year aligns on the retail calendar, so chain, region, store and hour never disagree.
Deployment approach
Door-counter feed by store and hour, timecard activity codes, ticket rules for tickets and sellers, store types and trading hours, and the retail calendar. Confirm which stores have counters.
Build the store day, store hour and employee facts; prove ticket parity to the ticket fact and hours parity to timecards; load the weekly budget and spread it to days. Publish the store traffic and store operations report sets and the store dashboard.
Build seasonality and hour profiles from the traffic history, set visits-per-staff-hour targets per store, and publish the forecast visits and recommended staff templates for the scheduling horizon.
Switch on the weekly workforce fact and the executive flash, connect the insight pages, and start the seasonal review of budgets, profiles and staffing ratios against measured conversion.