Sales by size are not demand by size
The size that sold out in week two shows up in the history as the size that sold least. Every curve fitted to raw sales inherits that error and buys fewer of it next season, so the run breaks earlier and the error grows. A size dataset has to record what was on the shelf when each unit sold, infer the demand for the sizes that were not, and keep the corrected share apart from the raw one. Then a store's curve is a fact with a confidence, not an average of its own stockouts.
The Cybex Size Optimization dataset is five facts on one style and colour, one size and one site. It sits beneath the assortment dataset, which decides what to carry, and beside the allocation and replenishment datasets, which decide how much. This one owns the size dimension of all three: the demand share by size, the profile at each scope, the stock position by size, the size split of every allocation and buy, and the performance of that split. Nothing here is specific to one retailer: size codes, size runs, family groupings and pack conventions are mapped to generic values at load time.
Five facts, one style, one size, one site
| Fact | Grain | Question it answers | Loaded from |
|---|---|---|---|
| Size demand | One row per style, colour and size per site per week | What sold by size, what was on the shelf when it sold, and what would have sold had every size been there? | Sales fact at SKU, daily stock history by size, receipts, transfers |
| Size profile | One row per scope (style, family, class and cluster, site) per size, versioned | What share of this style does each size take, here, and how sure are we? | Corrected size demand, family and class hierarchy, store clusters, planner overrides |
| Size stock position | One row per style and colour per site, sizes beneath, as of a date | Which sizes are present, is the run whole, and how long until it breaks? | Location stock by SKU, DC stock, on order, sales rate by size |
| Size allocation | One row per run, style and colour, site and size, by purpose (buy, initial allocation, replenishment, pack) | How many of each size should go here, and does it tie to the colour total? | Colour-level need or buy, size profile at the resolved scope, pack definitions, DC stock by size |
| Size performance | One row per style and colour, site, size and week | Did the split sell through evenly, which sizes were lost, and how close was the curve? | Sales, markdown units and stockouts by size, size profile used, allocation as sent |
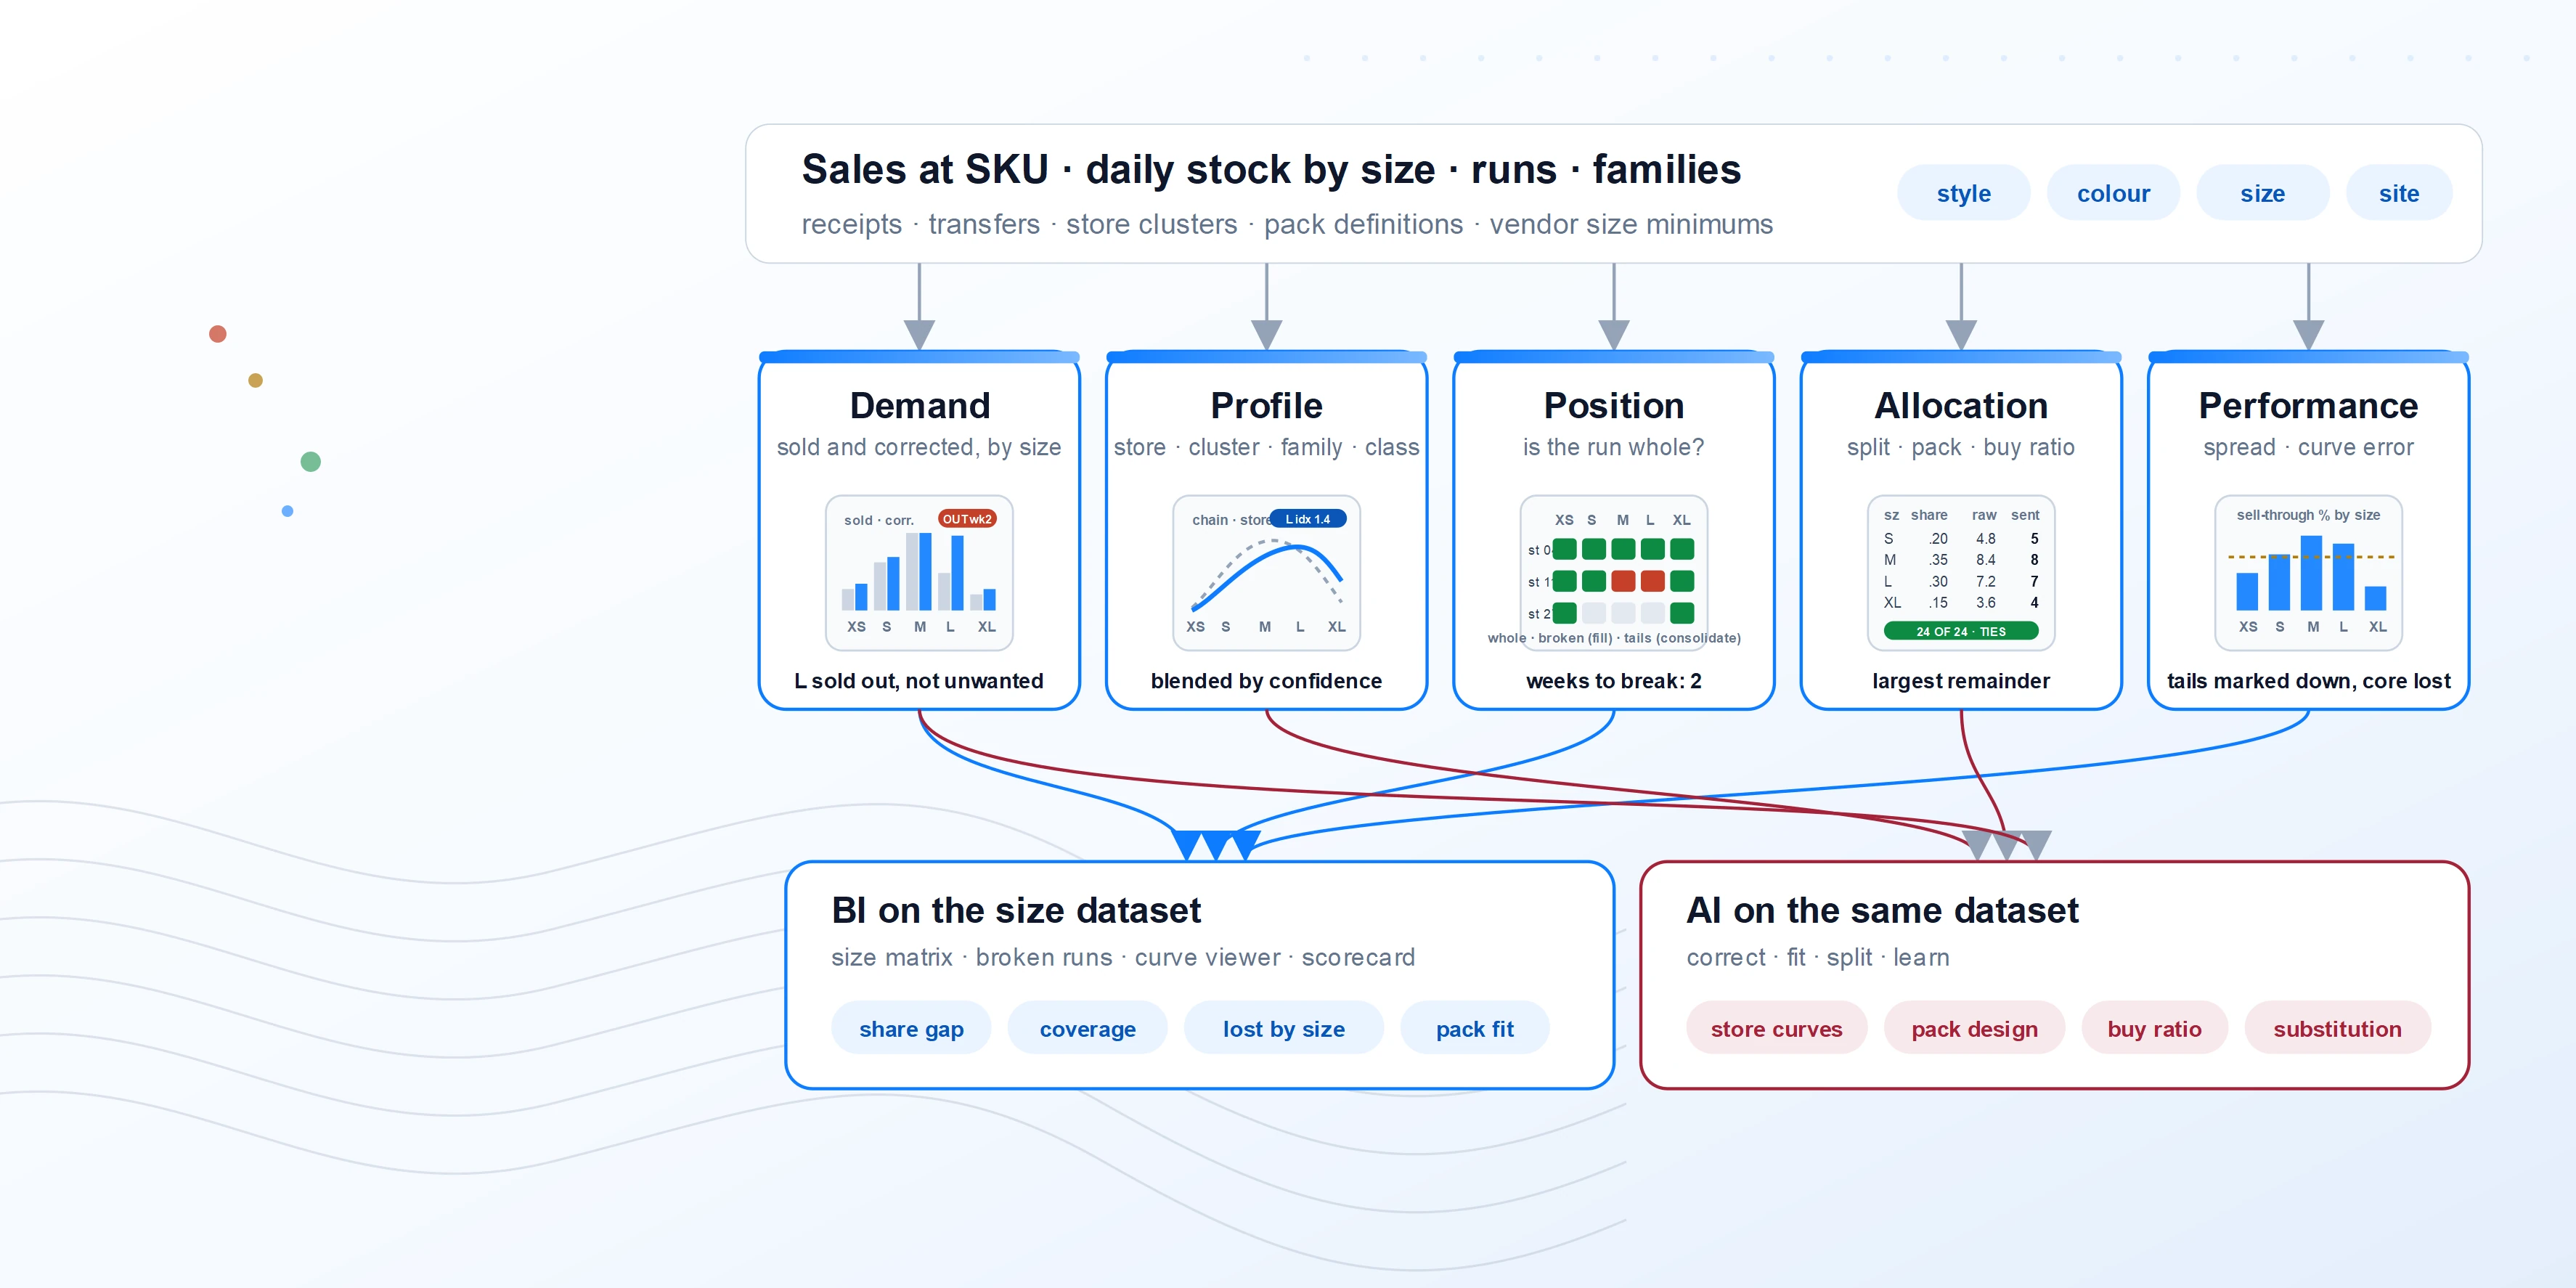
Figure: the five facts share style, size and site; the demand row keeps sold and corrected side by side so a curve can always be traced back to what was actually on the shelf.
Generic dataset attributes
Attributes are grouped by role. BI marks the ones the size matrix, broken-run and curve reports aggregate; AI marks the ones the correction, fitting and splitting engines consume. Most are both.
Size demand
| Group | Attributes | Notes | Used by |
|---|---|---|---|
| Identity | Style, Colour, Size, Size sequence, Size run, SKU, Site, Cluster, Family, Class, Department, Season, Retail week | Size sequence orders sizes for display and for neighbour-based inference; a run names the set of sizes the style was bought in. | BIAI |
| Sold | Units, Sales at retail, Markdown units, Returns, Sold share of colour, Days with any sale | Raw sales by size; never used as the curve directly. | BIAI |
| Availability | Days in stock, Days out of stock, In-stock % for the week, Stock at start and end of week, Run whole flag for the week | Availability is read from the daily stock history by SKU, not inferred from a sale. | BIAI |
| Corrected | Inferred demand for out-of-stock days, Corrected units, Corrected share of colour, Lost units, Lost sales at retail, Inference method, Confidence | Inference uses the sizes beside it and the same style elsewhere in the cluster; the method is stored with the number. | BIAI |
| Substitution | Adjacent-size substitution rate, Walk-away rate, Substitution units credited | Some demand for a missing size is captured by the next size; the share credited is a learned rate, not an assumption. | AI |
Size profile
| Group | Attributes | Notes | Used by |
|---|---|---|---|
| Identity | Scope level (style, family, class and cluster, class and site, department), Scope key, Site or Cluster, Size run, Size, Profile version, Fitted date, Set by (model, planner) | Scope key names the family or class the profile was fitted on; a family groups styles that share a fit and run, such as a private label style and its blank. | BIAI |
| Share | Share of colour (sums to one per scope), Raw share, Corrected share, Chain share, Store index versus chain by size, Cumulative share by size sequence | Store index by size is the multiplier the allocation and replenishment datasets apply to the chain rate. | BIAI |
| Quality | Observations (units), Weeks of history, Share confidence, Fallback level used, Blend weight between levels, Drift versus prior version | A store with thin history is blended toward its cluster; the weights are stored so the planner can see how much is store and how much is cluster. | BIAI |
| Override | Planner share, Reason, Effective window, Locked flag | An override is data the engine reads; it is versioned and expires, so a one-season correction does not become a permanent rule. | BIAI |
Size stock position
| Group | Attributes | Notes | Used by |
|---|---|---|---|
| Identity | Style, Colour, Site, Size run, As-of date, Core size set, Sizes in run | Core sizes are the ones whose absence makes the run look broken to a customer; usually the middle of the curve. | BIAI |
| By size | On hand, DC on hand, On order, Inbound, Sales rate by size, Weeks of supply by size, Profile share, Stock share, Share gap (stock share minus profile share) | Share gap is the fastest way to see a size that is over-bought or under-bought at this store. | BIAI |
| Run health | Sizes present, Core sizes present, Coverage % (units-weighted), Run whole flag, Broken run flag, Fragmented flag (tails only), Weeks until the run breaks at the current rates, First size to break | Weeks until break uses WOS by size; it says when the run stops selling like a whole run, not when the style runs out. | BIAI |
| Remedy | Fill sizes needed to make the run whole, Fill units, Consolidation candidate flag, Consolidation target site | A broken run is either filled from the DC or consolidated to a store where the tails complete a run; the remedy is stored, not just the flag. | BIAI |
Size allocation
| Group | Attributes | Notes | Used by |
|---|---|---|---|
| Identity | Run id, Run date, Purpose (buy, initial allocation, DC replenishment, consolidation, pack design), Style, Colour, Site (or DC for a buy), Size, Profile version used, Scope level used | Every split records which profile it used, so a poor sell-through can be traced to the curve rather than the quantity. | BIAI |
| Split | Colour total, Share applied, Raw size quantity, Rounded size quantity (largest remainder), Minimum per size, Presentation minimum by size, Adjustment for stock already at site by size | The split nets off what the site already holds by size, so a store heavy in one size is not sent more of it. | BIAI |
| Pack | Pack id, Pack composition by size, Packs per site, Loose units by size, Pack fit score (composition versus profile), Prepack versus pick flag | Pack fit is how far a pack's composition sits from the profile it serves; a low score is a reason to redesign the pack, not to send more of it. | BIAI |
| Buy | Buy quantity by size, Vendor size minimum and multiple, Size ratio as ordered, Ratio versus corrected chain profile, Sizes dropped from the run and why | The buy ratio is judged against the corrected profile, so last season's stockouts do not shape this season's order. | BIAI |
| Outcome | Accepted quantity by size, Transfer, PO or pack reference, Deviation from recommendation, Reason | Closes the loop for performance and for learning. | BIAI |
Size performance
| Group | Attributes | Notes | Used by |
|---|---|---|---|
| Identity | Style, Colour, Site, Size, Retail week, Weeks since allocation, Allocation run id, Profile version used | Read as a curve by week from the allocation, per size. | BI |
| Sell-through | Units received by size, Units sold by size, Sell-through % by size, Sell-through spread across sizes, First size to sell out, Weeks to first sell-out, Residual by size at exit | Spread is the gap between the best and worst selling size; a good curve keeps the spread narrow. | BIAI |
| Loss | Lost units by size, Lost sales at retail, Broken-run weeks, Sales rate while broken versus whole, Markdown units by size, Markdown erosion by size | Markdown by size shows the tails; lost sales by size shows the core. Both come from a curve that was wrong in opposite directions. | BIAI |
| Accuracy | Profile share used, Realised corrected share, Absolute error by size, Curve error (mean absolute, units-weighted), Bias by size sequence (small, core, large), Error by scope level | Error by scope level tells the fitting engine whether store-level profiles are earning their complexity. | AI |
| Rollup | Size-driven lost sales by class and cluster, Broken-run rate, Pack fit trend, Buy ratio error by vendor, Curve accuracy by department | The season scorecard by department, vendor, cluster and pack. | BI |
Profile(scope) = blend(Store, Cluster, Class) by confidence · StoreIndex(size) = Share(store) ÷ Share(chain)
Split(size) = round_largest_remainder(ColourTotal × Share) − StockAtSite(size)⁺ · Σ Split = ColourTotal
WeeksToBreak = min over core sizes (OnHand ÷ RateAtSite(size)) · CurveError = Σ |ShareUsed − ShareRealised| × units ÷ Σ units
Functional areas and what each reads
| Functional area | Reads | Deciding attributes | BI output | AI output |
|---|---|---|---|---|
| Size matrix and stock status | Position, Demand | On hand by size, share gap, coverage, run whole flag | Size matrix by style, colour and site; stock-sales by size; share gap heat map | Broken-run forecast by store for the coming weeks |
| Size curve management | Profile, Demand | Corrected share, confidence, fallback level, overrides | Curves by family, class, cluster and store with confidence; raw versus corrected; override log | Fitted and blended profiles per scope; drift alerts; scope-level recommendation |
| Buy size ratio | Allocation (buy), Profile, Performance | Corrected chain profile, vendor minimums, last season's error by size | Buy ratio by style against the corrected profile; sizes dropped and why | Recommended buy ratio per style and vendor; run recommendation (which sizes to carry) |
| Initial allocation and packs | Allocation, Profile, Position | Store profile, pack composition, pack fit, presentation minimum by size | Allocation by size per store; pack usage and loose units; pack fit by cluster | Pack design by cluster; pack-versus-pick decision; size split with store stock netted |
| Replenishment by size | Position, Allocation (replenishment) | WOS by size, weeks to break, fill sizes, DC stock by size | Fill lists by size; DC size availability; first-to-break report | Size-level need timed to keep runs whole; fill prioritisation when the DC is short in a size |
| Consolidation | Position | Fragmented flag, consolidation target, rate while broken | Tails by store; consolidation candidates and targets | Consolidation plan that completes runs with the fewest moves |
| Size performance and learning | Performance, Profile | Sell-through spread, lost by size, markdown by size, curve error | Size scorecard by department, cluster, vendor and pack; lost sales by size | Refreshed profiles from realised share; substitution rates; bias correction by size sequence |
Rules the dataset carries
Demand and profile
- Sold and corrected both kept. The raw share is never overwritten by the inference; a curve can always be traced to what was on the shelf.
- Availability from stock history. A size is out of stock when the daily stock says so, not when a week has no sale.
- Deepest scope with history, blended. Store first, then cluster, then family and class; the blend weights and the level used are stored with the share.
- Overrides expire. A planner's share carries a window and a reason, and the engine reads it as data until it lapses.
Position and allocation
- A run is whole or it is not. Coverage is judged on the core sizes together; a store holding only tails is fragmented, not stocked.
- Sizes tie to the colour. Every split rounds by largest remainder to the colour total, so a pack, transfer or PO equals the need that justified it.
- Net what the store holds. The split subtracts stock already at the site by size before it rounds.
- The buy is judged on the corrected curve. Last season's stockouts are not allowed to shape this season's ratio.
Performance
- Every split names its profile. Performance is attributed to the curve version and scope used, not just the quantity sent.
- Loss and markdown by size are read together. Core sizes lost and tail sizes marked down are the two halves of one curve error.
- Accuracy by scope level. Store-level profiles must beat the cluster on realised share or the engine falls back.
- Substitution is learned. The share of a missing size's demand that moved to a neighbour is measured, not assumed.
Process workflow
The size cycle runs weekly for demand correction and position, on the buying calendar for ratios and packs, and nightly wherever the allocation and replenishment engines split a colour quantity to size. The Hub runs the left half unattended; buyers and allocators run the middle; the AI layer corrects and fits ahead and learns behind.
Cadence
| When | Step | Output | Owner |
|---|---|---|---|
| Continuous | Capture | Sales and stock by size current to the last transaction | POS, WMS |
| Nightly | Position, split | Size stock position; size splits for replenishment and consolidation | AI Data Hub |
| Weekly | Correct, fit | Corrected demand by size; profiles and store index by size; drift alerts | AI Data Hub |
| Weekly | Allocation review | Splits and packs accepted or adjusted; fills and consolidations released | Allocation planners |
| Buying calendar | Ratio and run review | Buy ratios by style and vendor; runs confirmed; pack designs by cluster | Buyers, merchandise planning |
| Season end | Learn and feed back | Size scorecard; profile refresh; substitution rates; buy-ratio feedback to assortment and planning | Planning, data science |
Where BI ends and AI begins
BI on the size dataset
AI on the same dataset
Both read the same five facts. The share gap a planner sees on the size matrix is measured against the profile the split used, and the lost sales in the scorecard are the ones the corrected demand inferred.
What a conforming dataset delivers
Curves that stop echoing stockouts. Corrected demand feeds the profile, so the size that sold out early is bought deeper next time, not shallower.
Runs that stay whole longer. Weeks to break and the first size to break drive fills and consolidations before the run stops selling as a run.
Splits that tie and can be traced. Every buy, allocation and pack sums to its colour total and names the profile it used, so performance improves the curve rather than the argument.
Deployment approach
Map size codes and sequence, size runs by class, family groupings, store clusters and pack definitions; confirm daily stock history exists at SKU and site, and how sizes are identified on the sales fact.
Build size demand with availability and corrected share, fit profiles by scope with confidence and blend weights, publish store index by size. Publish the size matrix, curve viewer with raw versus corrected, and the share gap heat map.
Compute the size stock position with run health and remedies; connect the split to the allocation and replenishment engines with netting and largest-remainder rounding; score existing packs; prove every split sums to its colour total.
Switch on size performance with sell-through spread, loss and markdown by size and curve error by scope; start the profile refresh, substitution learning and buy-ratio feedback to assortment and planning.